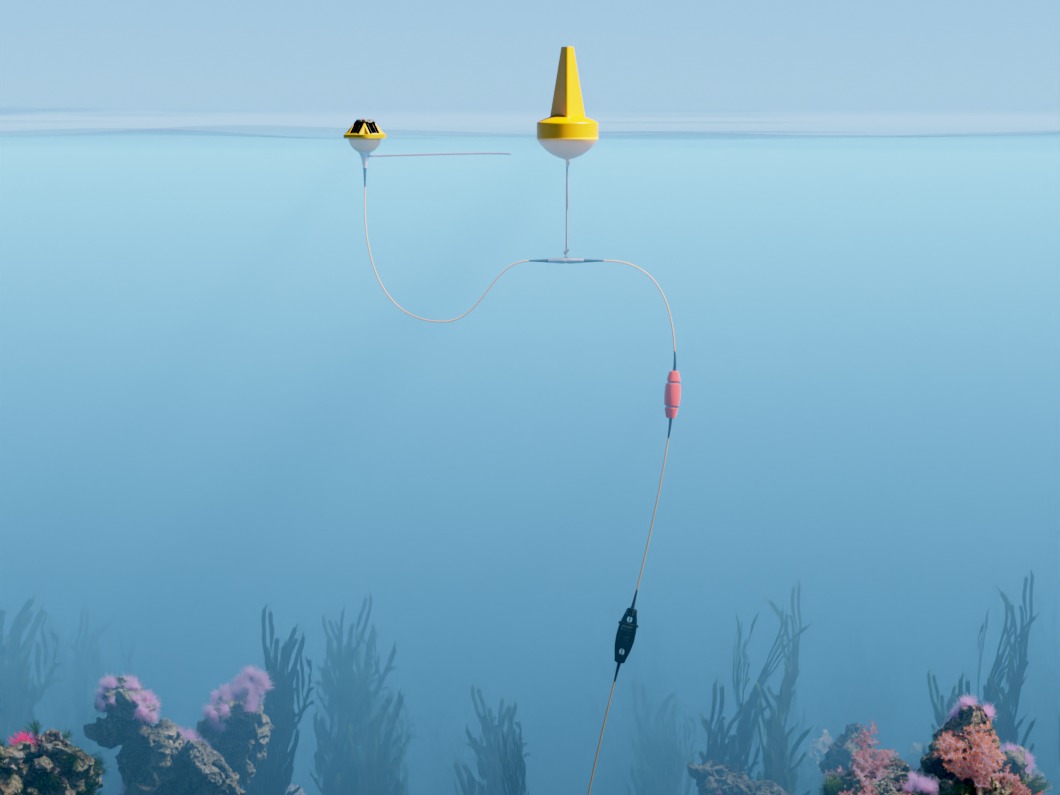
Sofar makes Spotter, a solar-powered ocean buoy, and Wayfinder, software that helps ships plan voyages using that data. I was the only designer for most of my two years there, across product, web and marketing.
A voyage report you can read in a minute
At the end of a voyage, Wayfinder tells the ship operator how the ship did against its charter: the promised speed and the promised daily fuel burn. Money changes hands on that answer. In December 2022 it came out as a spreadsheet: position, engine, speed and fuel, all at the same weight. Everything was in there. Finding out whether the ship gained or lost time meant reading every column.
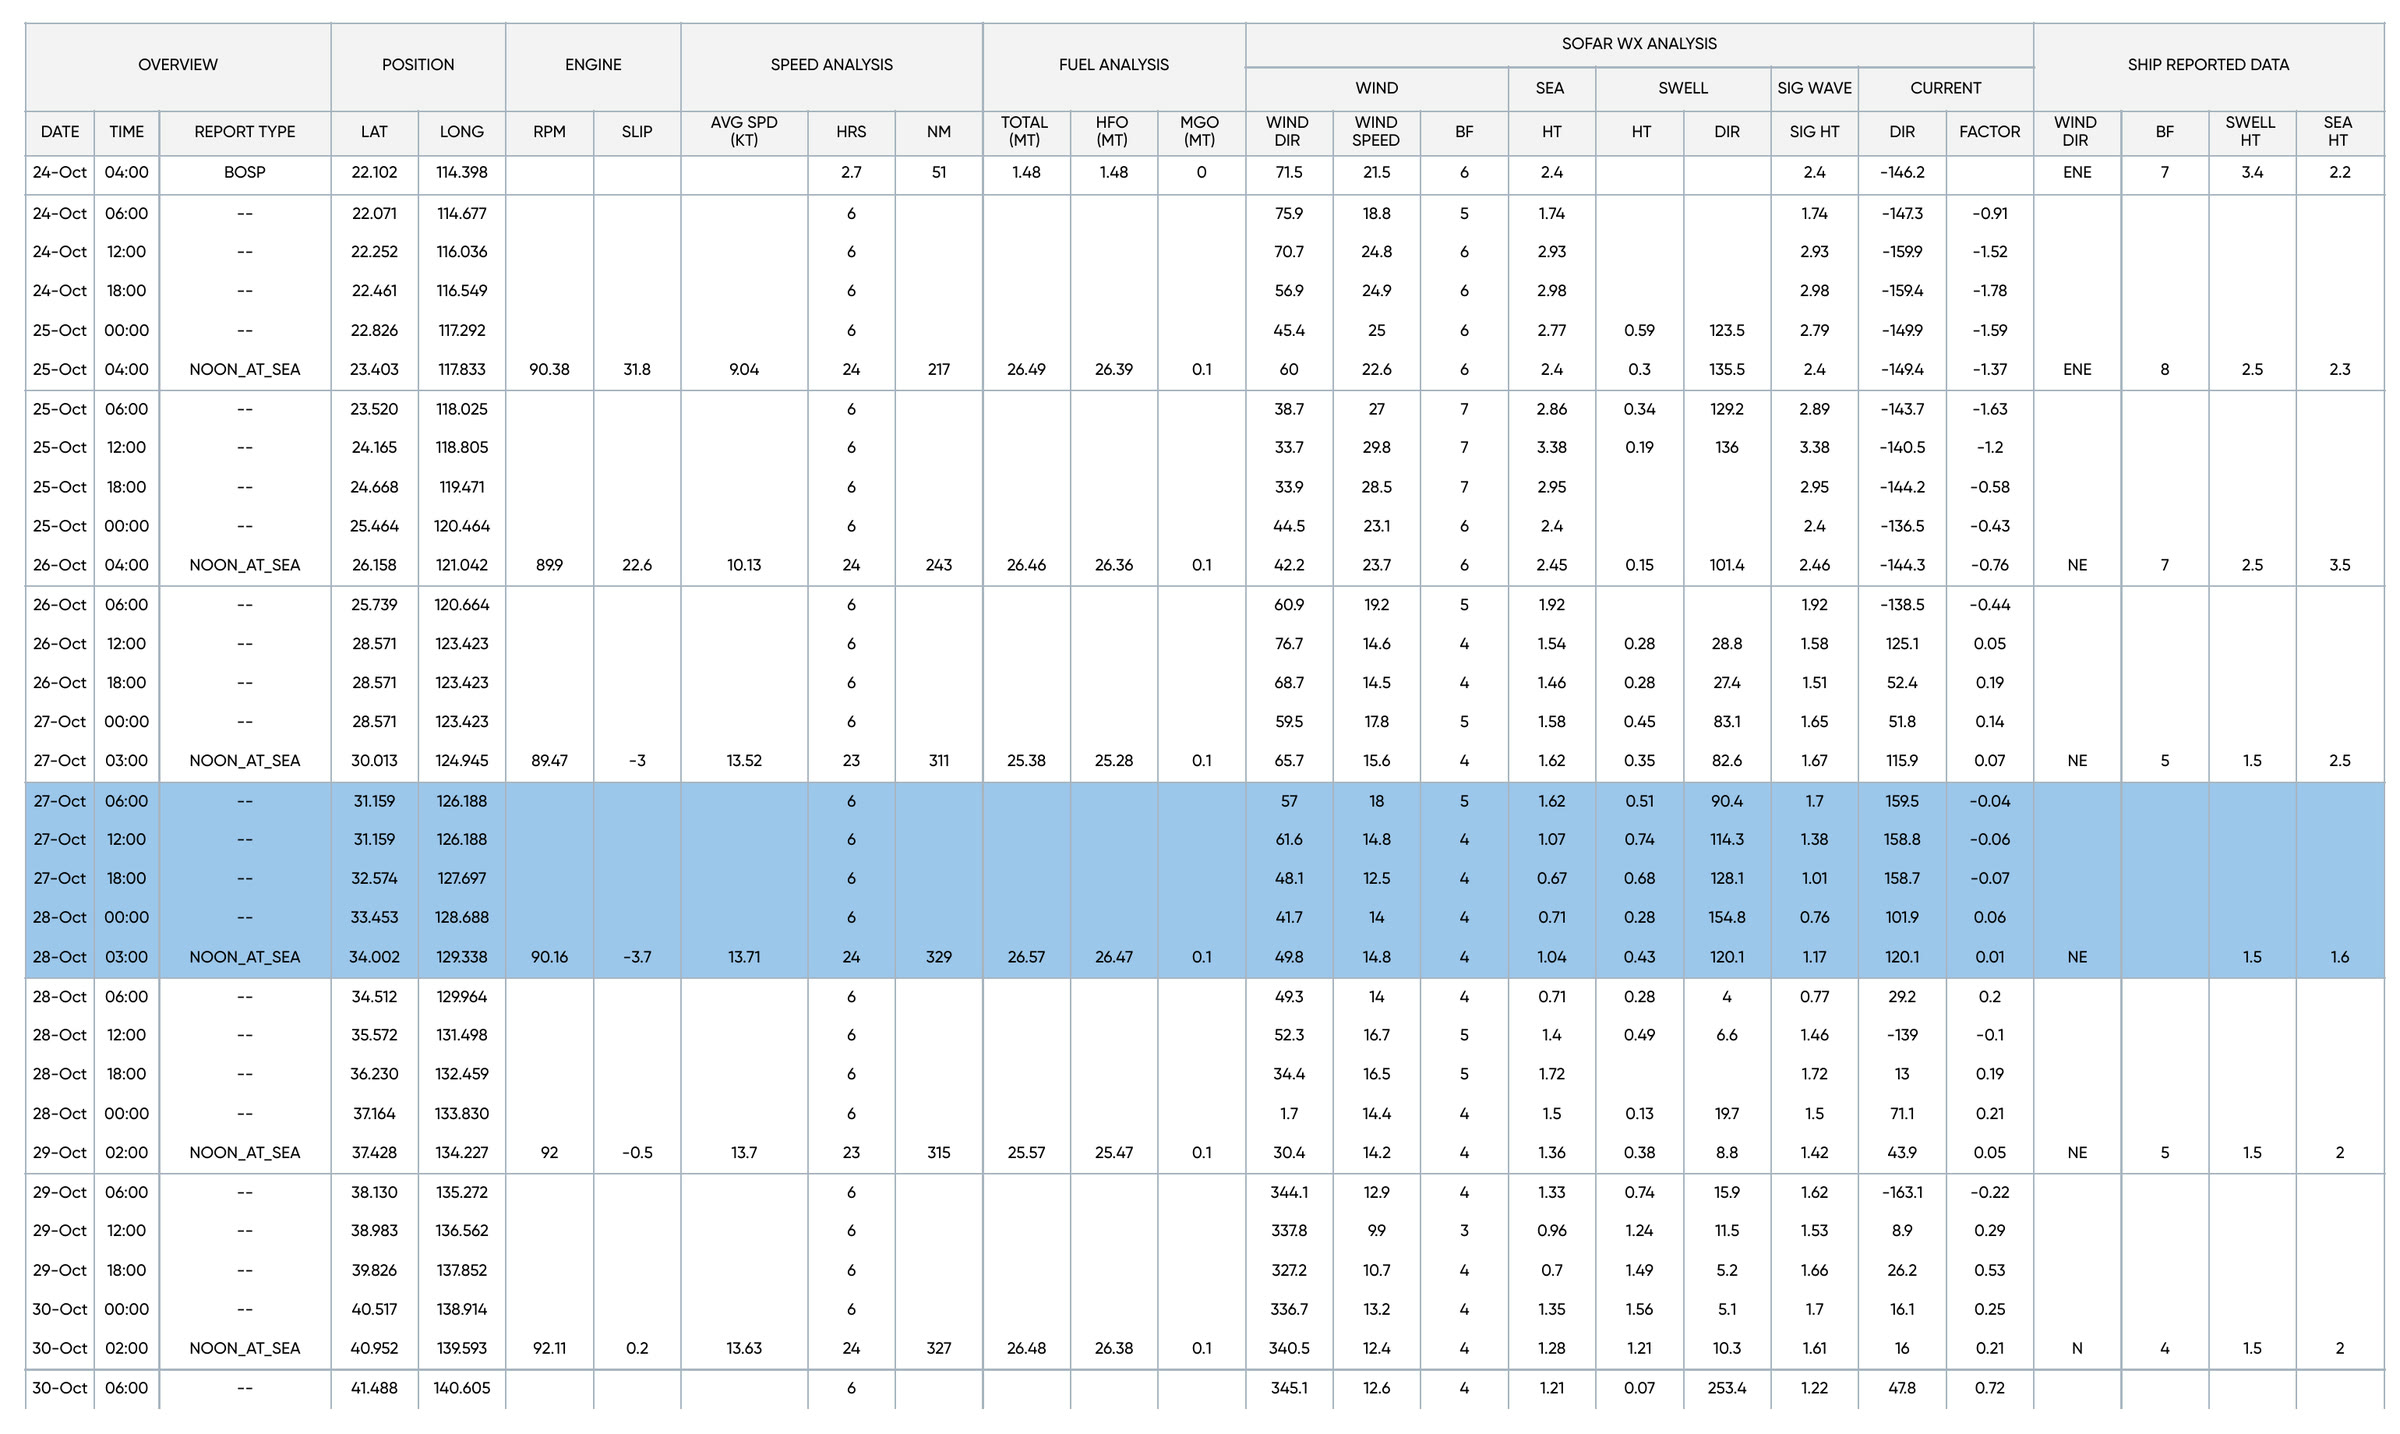
The report before, December 7, 2022.
I turned it into a report that answers before it explains. Each section asks one question: did the ship make time, did it burn more fuel than the charter allows. The answer goes on top in plain words, like Time Loss, 38.4 hours. Next to it, a bar shows the window the charter allows and where the ship actually landed. Under that, the math.
The first version went to the product team the day after the spreadsheet. I brought several directions, each labelled with what it was for, and we chose one together.
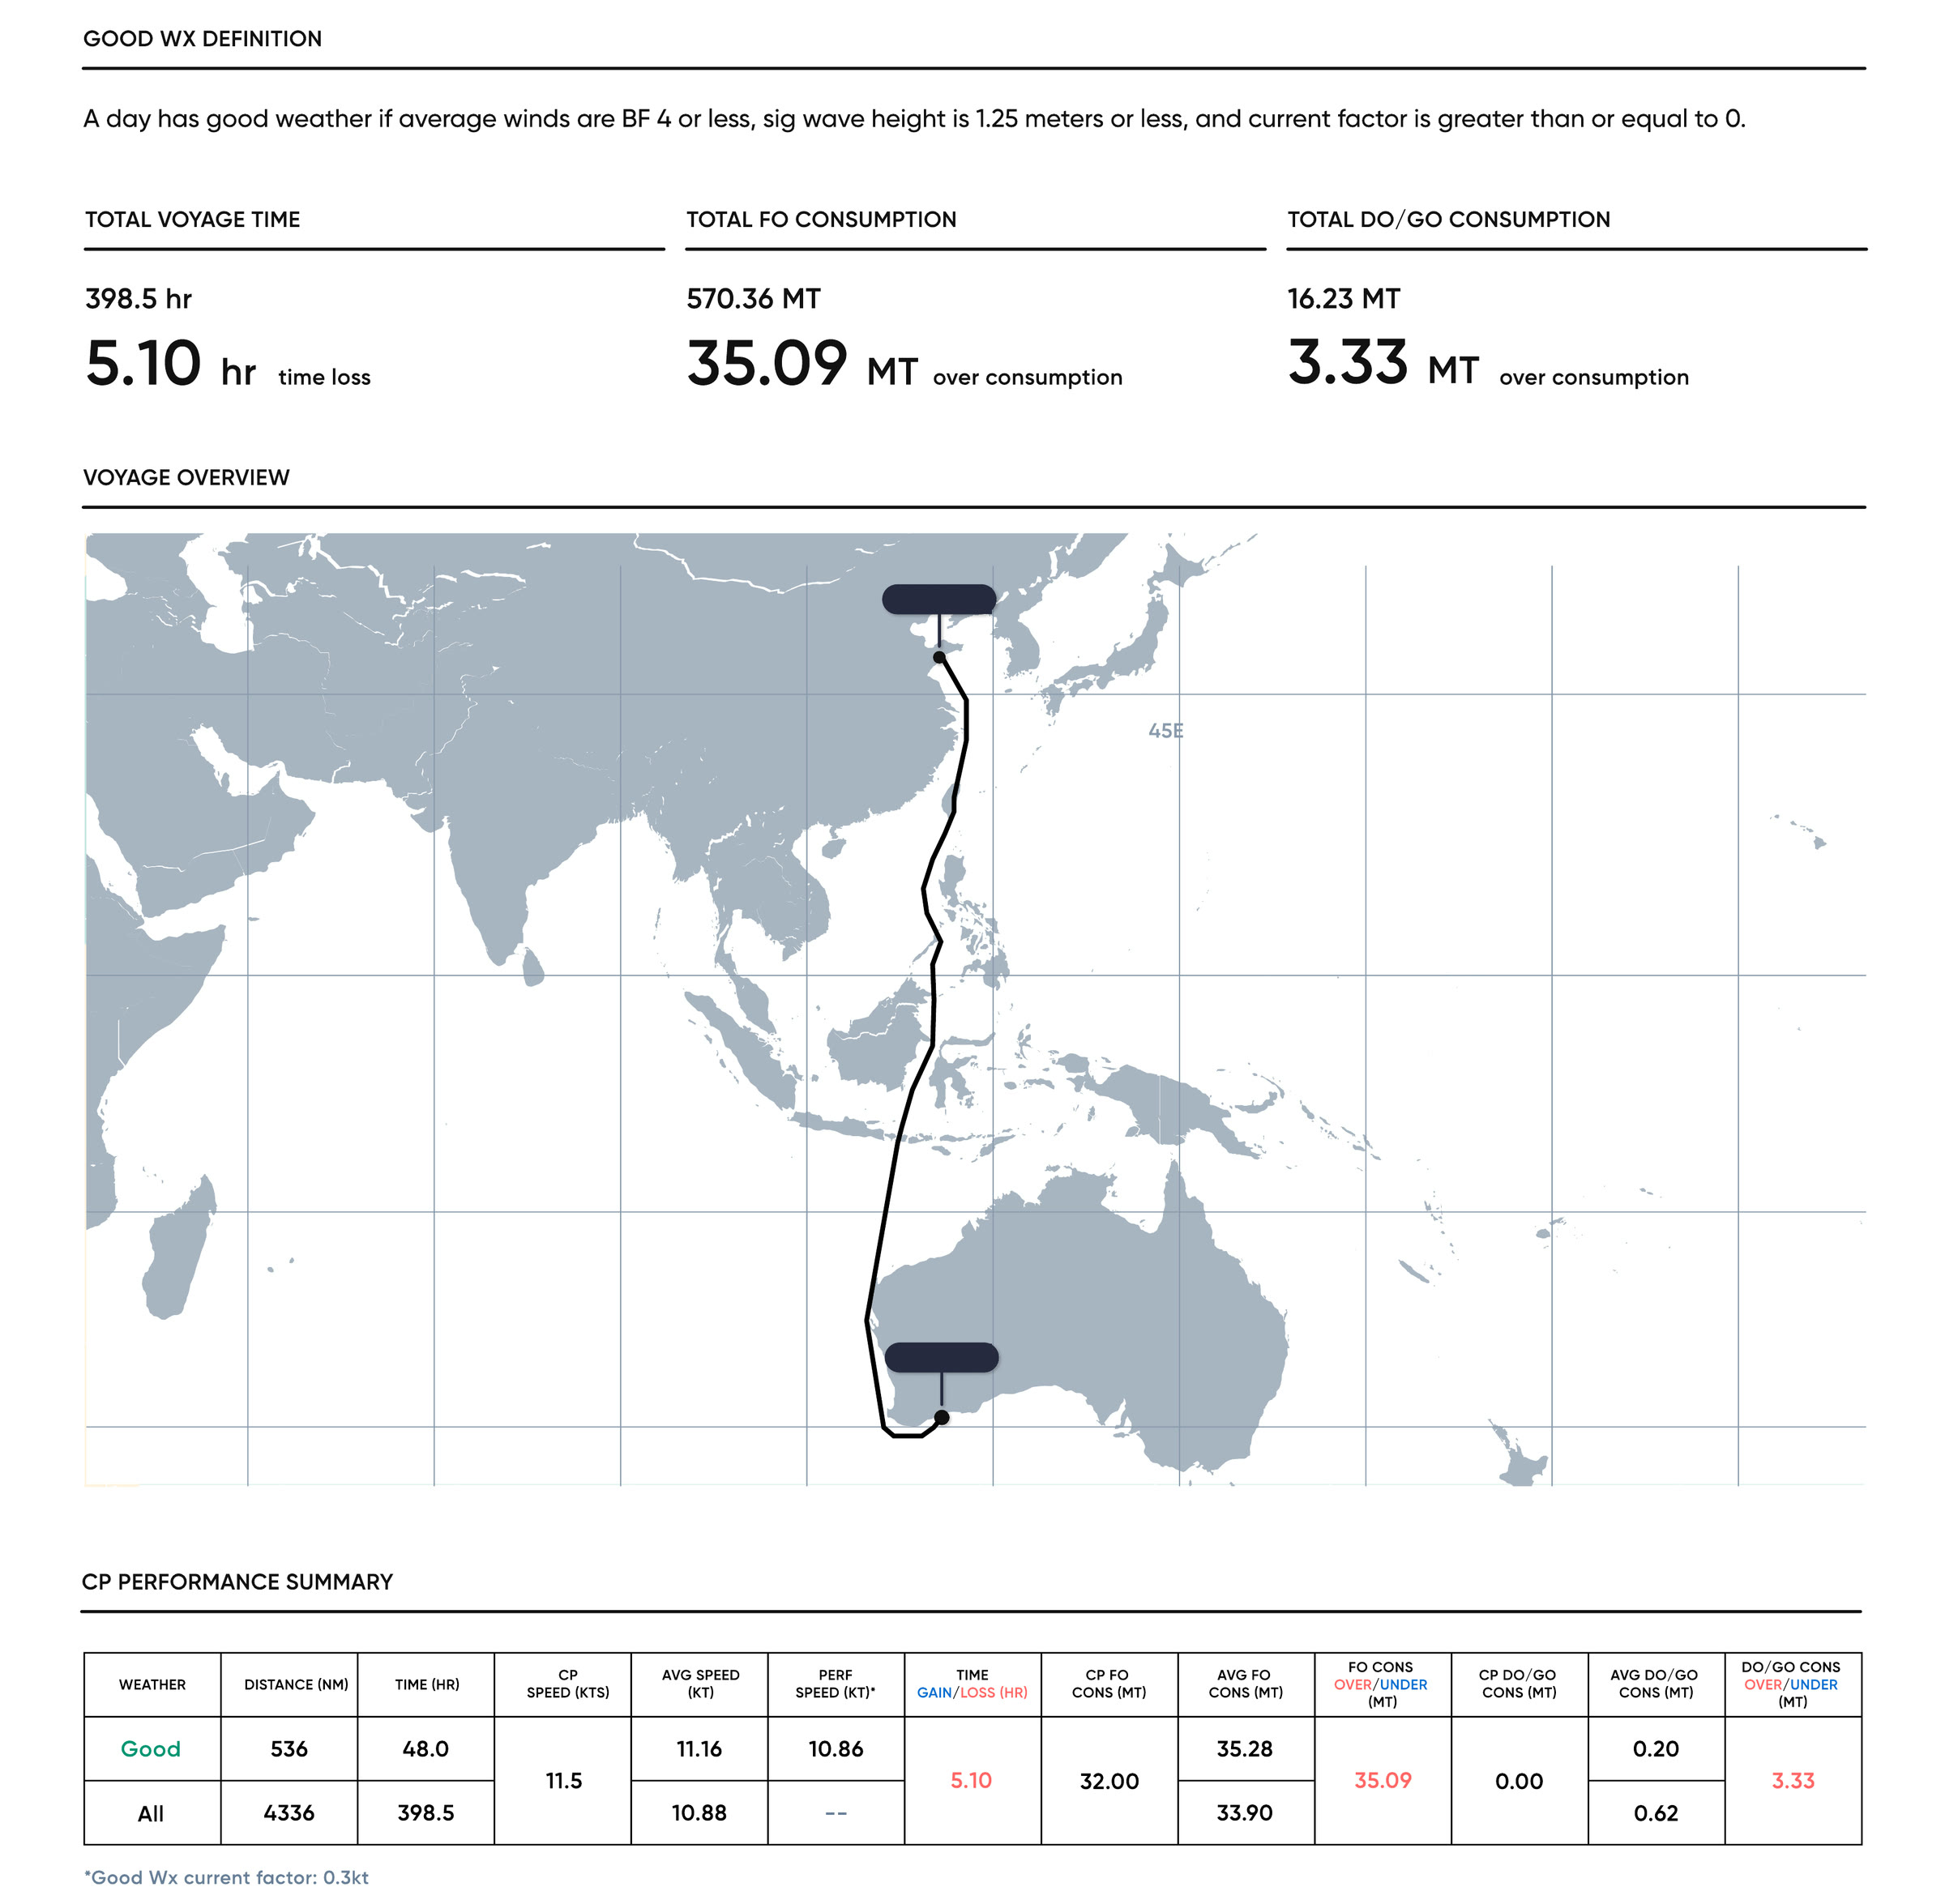
My design, the next day. Port names removed.
Every section works the same way. The charter sets a range. Bad-weather days are set aside, so the ship isn't blamed for a storm. Then the ship's good-weather result lands inside the range, or it doesn't, and the gap is the answer. Here is that section from my report, for two voyages. Switch between them.
The formulas are the least pretty part of the page, and I kept them on purpose. A charter is a contract, and the formulas are how it defines its terms: what warranted speed means, how much fuel tolerance the ship gets. An operator taking a claim to the charterer has to be able to show every step, so the working sits right under the answer. The formulas came from Sofar's product and data team. How they read on the page is mine.
The layout had to hold however the voyage went, so I designed every state a section can land in: time lost or gained, fuel over or under, within range, and no good-weather days at all. Sofar's product managers listed the edge cases: missing noon reports, charter constraints never entered. I designed a state for each. A missing noon report is a red alert, because the analysis can't be trusted without it. A missing constraint stays quiet, because it is often expected.
It was live in the app by mid-January 2023, going out in customer reports by August, and Sofar still ships the same structure in 2026.
The report in Sofar's 2026 product demo.
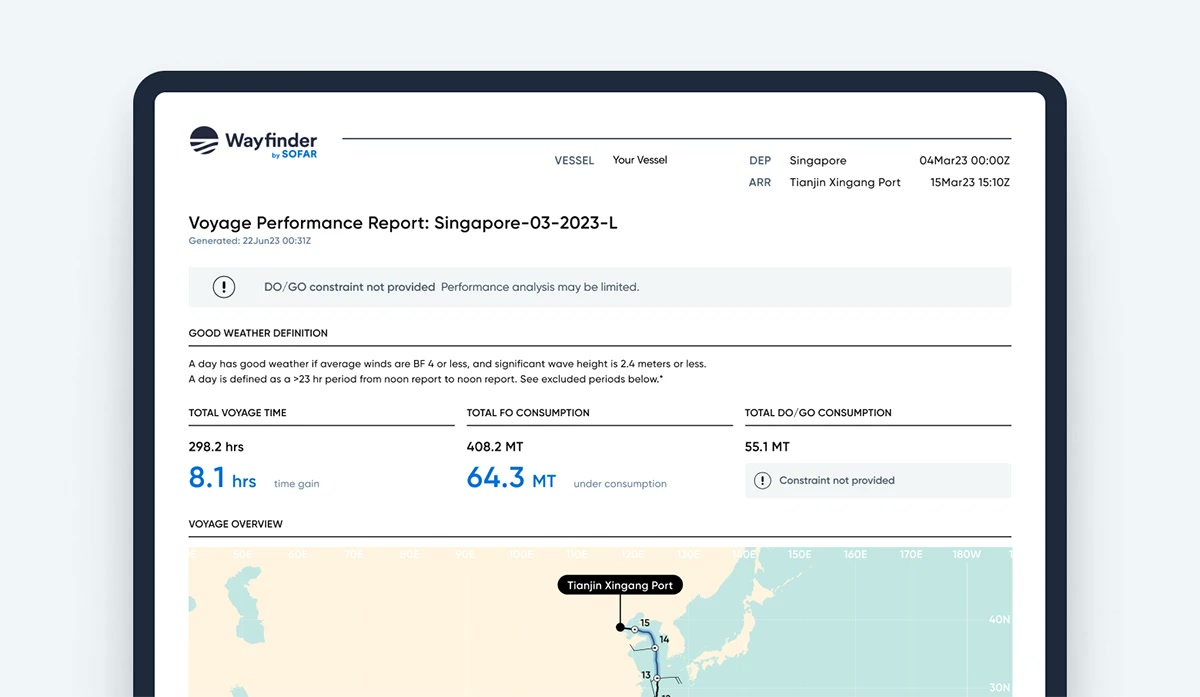
On sofarocean.com, November 2023.
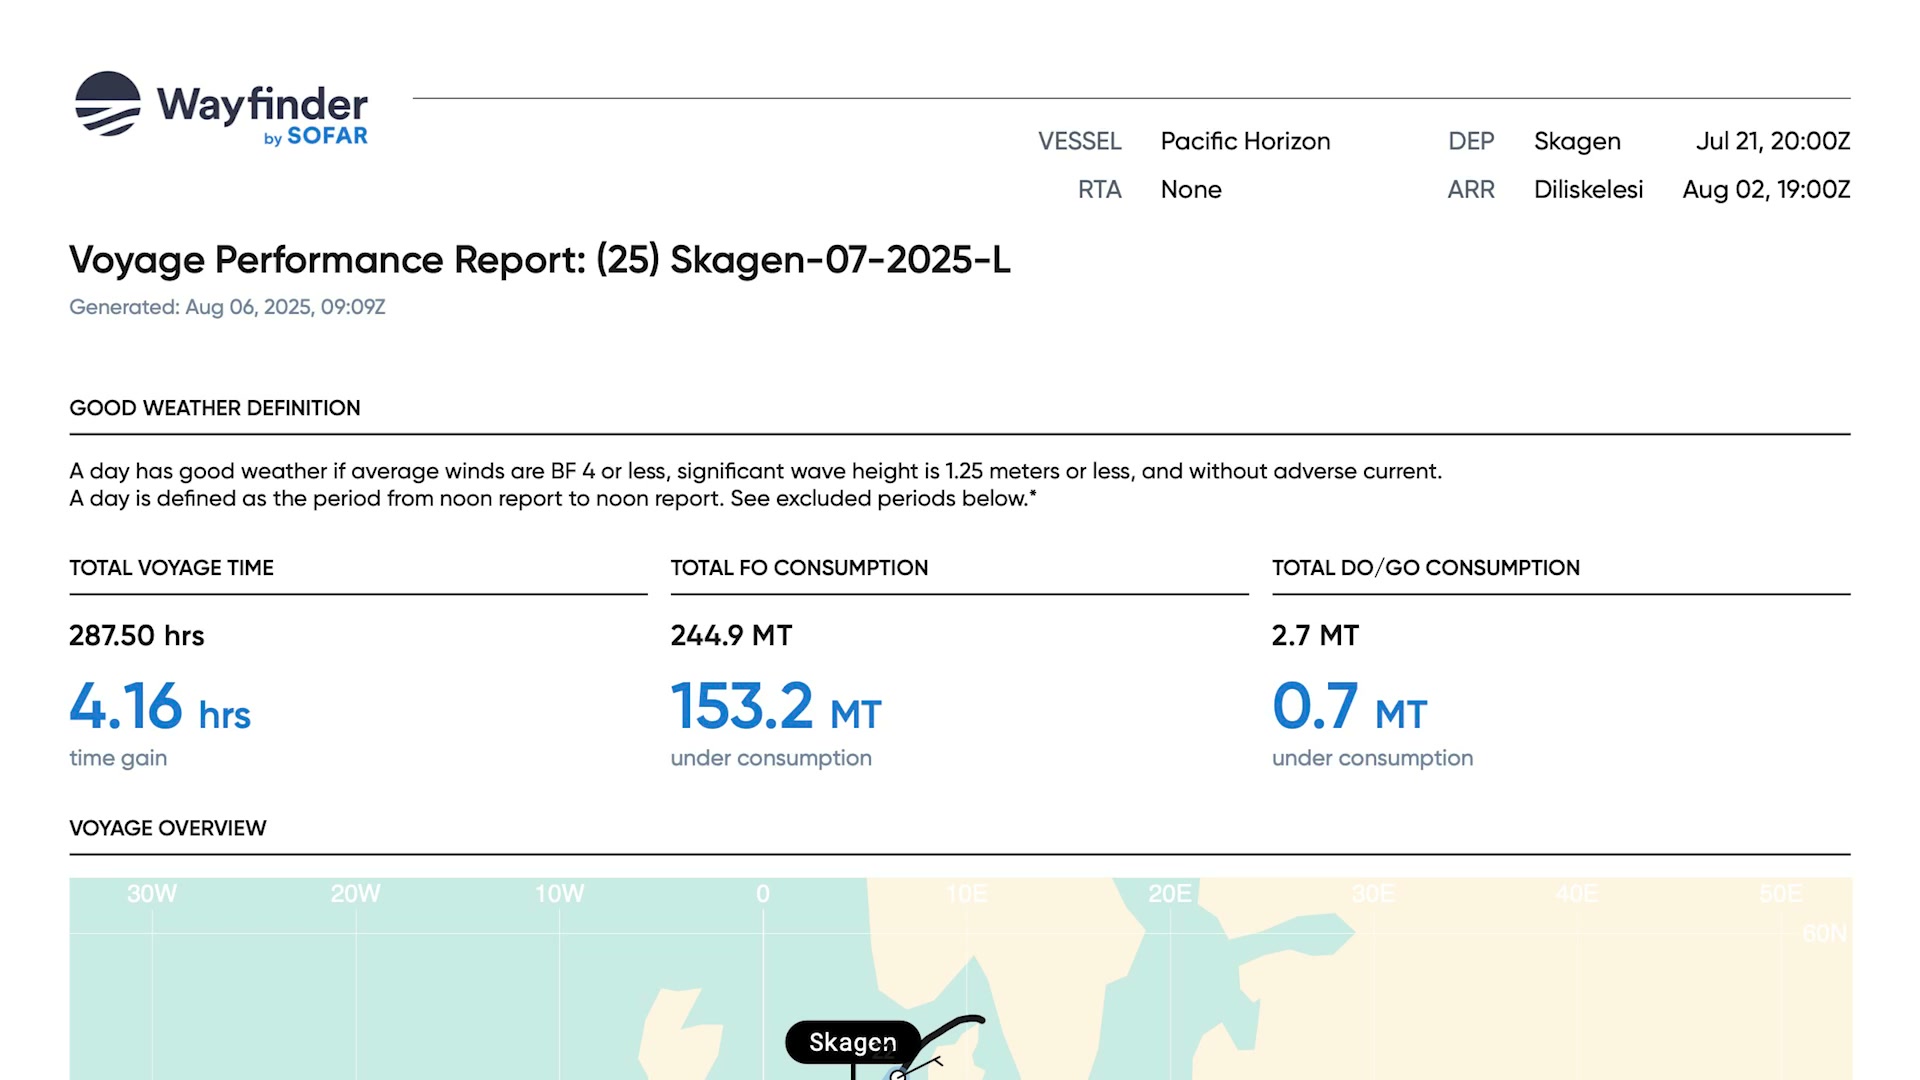
The top of the report in 2026.
From 2023, every ship over 5,000 gross tons gets a yearly Carbon Intensity Indicator grade from A to E, and a ship rated D three years running or E once has to file a corrective plan. Operators needed to see that coming across a whole fleet. In the CII sprints I added a CII tab to Fleet View, the fleet table I had helped land: one row per ship and one grade per month, so a run of red reads at a glance.
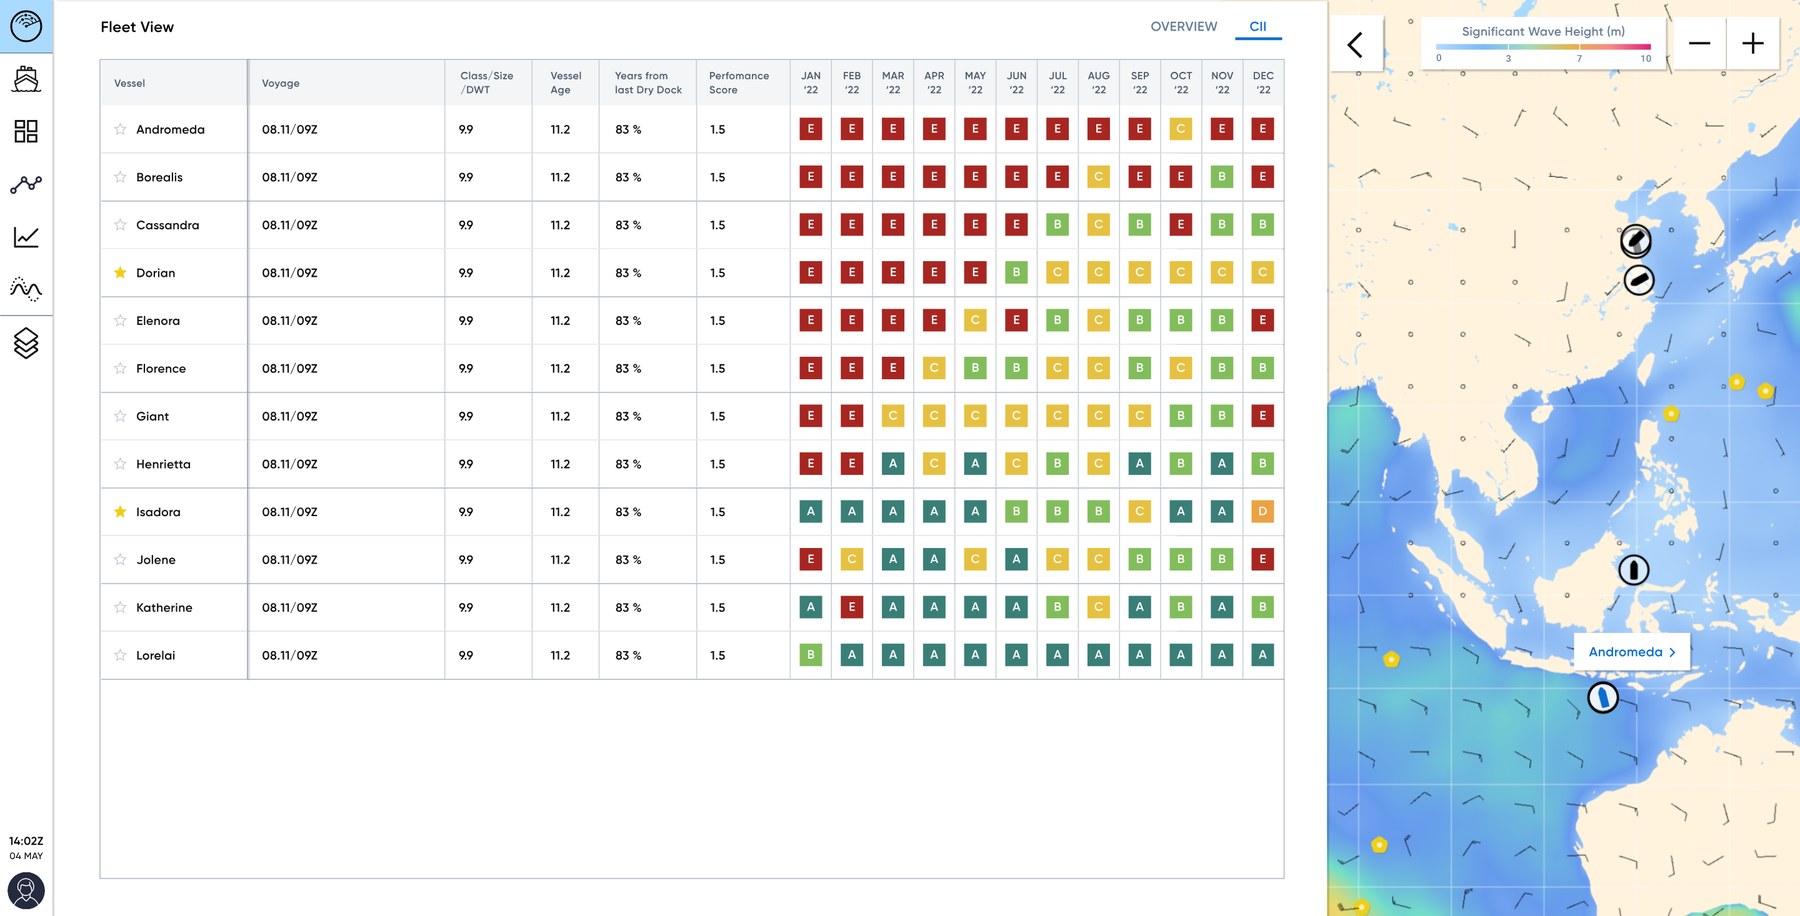
Fleet View, CII tab: a grade for every ship, every month, beside the fleet on the weather map. Demo fleet.
Wayfinder keeps a model of how much fuel each ship burns at each speed, rebuilt from its daily noon reports, with one curve per weather level on the Beaufort scale. Operators wanted to hold that against the ship's dry-dock curve: the baseline from when the hull was last cleaned, so you can see how much more fuel it now burns at the same speed.
A baseline only means something against one weather level. I worked out the rules over three revisions of mocks: the Dry Dock curve can only be turned on when a single weather level is selected. Picking a second level turns it off and explains why, dropping back to one makes it available again, and a ship with no baseline on file, or a broken one, says so and points to support.
The shipped chart, in the product video I made for the Wayfinder page.
Before Wayfinder can route a ship, someone has to enter the voyage: ports, departure, a required arrival time, whether the ship is loaded, and what the charter allows. Many voyages have several legs. The first version put all of that in a side drawer. With two or three legs it became a long scroll of near-identical fields squeezed beside a map that didn't need the room yet. So I moved creation into a modal with a tab for each leg. A leg you've left unfinished gets a red dot, so you can see what still needs filling in before you submit.
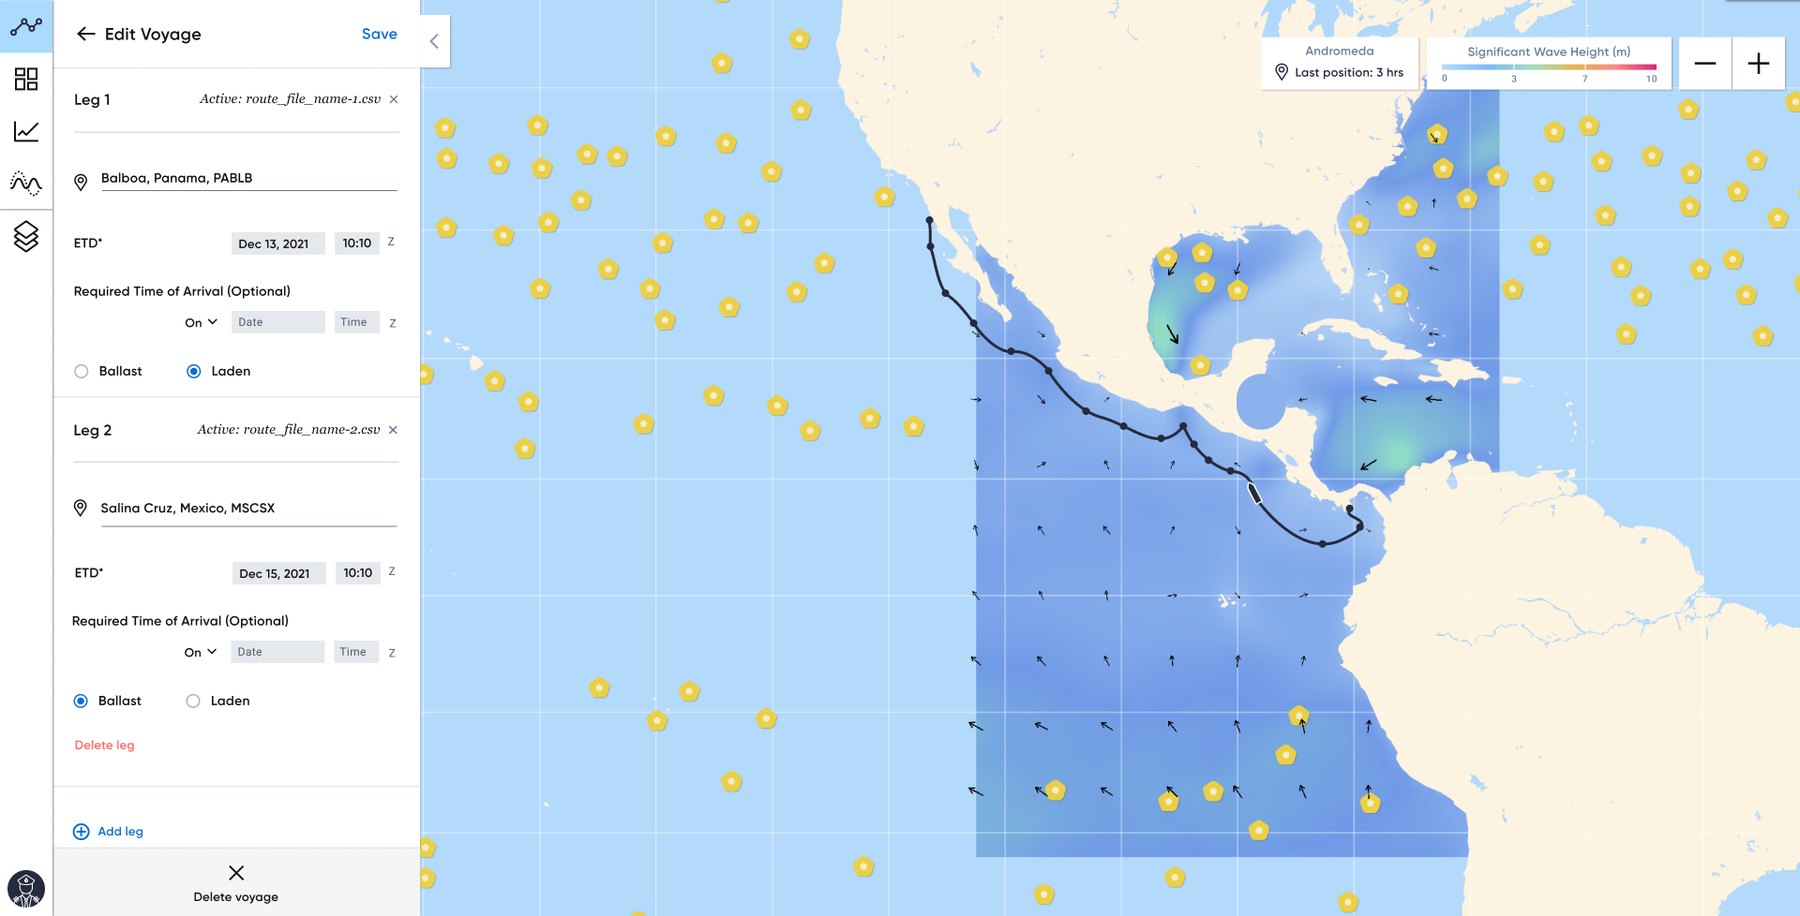
Before: legs stacked in the drawer.
I also made the product videos that sold it. The homepage in 2022 opened on a ship that turns into Wayfinder's map, and the Wayfinder page I built in 2024 walked through the product in short screen recordings.
The 2022 homepage film: the ship becomes the route.
Active route against a suggested route around a storm.
Weather along the route.
Weather layers.
Voyage guidance on the dashboard.
The report I drew in December 2022 is still the structure Wayfinder sends at the end of every voyage.
A homepage that's still running
I joined Sofar as a contractor to refresh sofarocean.com in Webflow, keeping its structure. It went live four weeks later, and they hired me. From then until I left in 2024 I ran the Webflow site: new pages, product launches and updates, including About, Wayfinder and Data Services.
The homepage hero is a 12-second loop I made: the globe turning under the weather, with Spotter buoys dotted across it. It's still the hero on sofarocean.com today. So is the logo animation that plays when you hover over the Sofar logo, running here from the same file.
The homepage hero, as it runs on sofarocean.com.
The logo animation, live on sofarocean.com.
On the Spotter product page I built a configurator for the three ways to deploy a buoy, each shown with a cutaway I rendered: free floating, a conventional mooring, or Sofar's Smart Mooring.
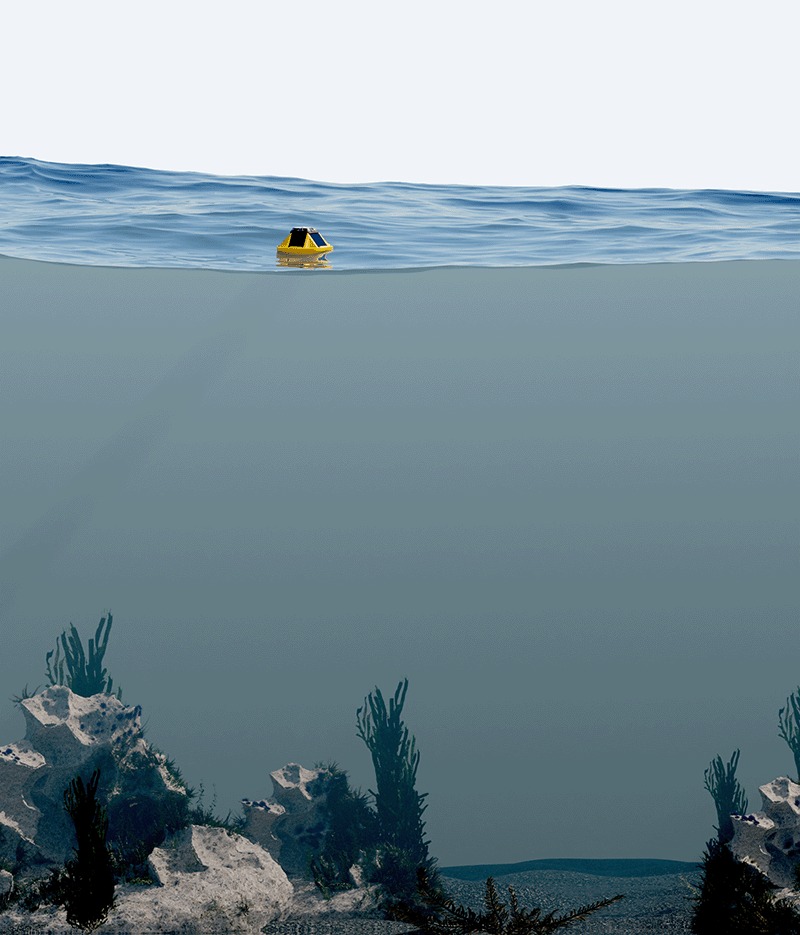
Free floating.
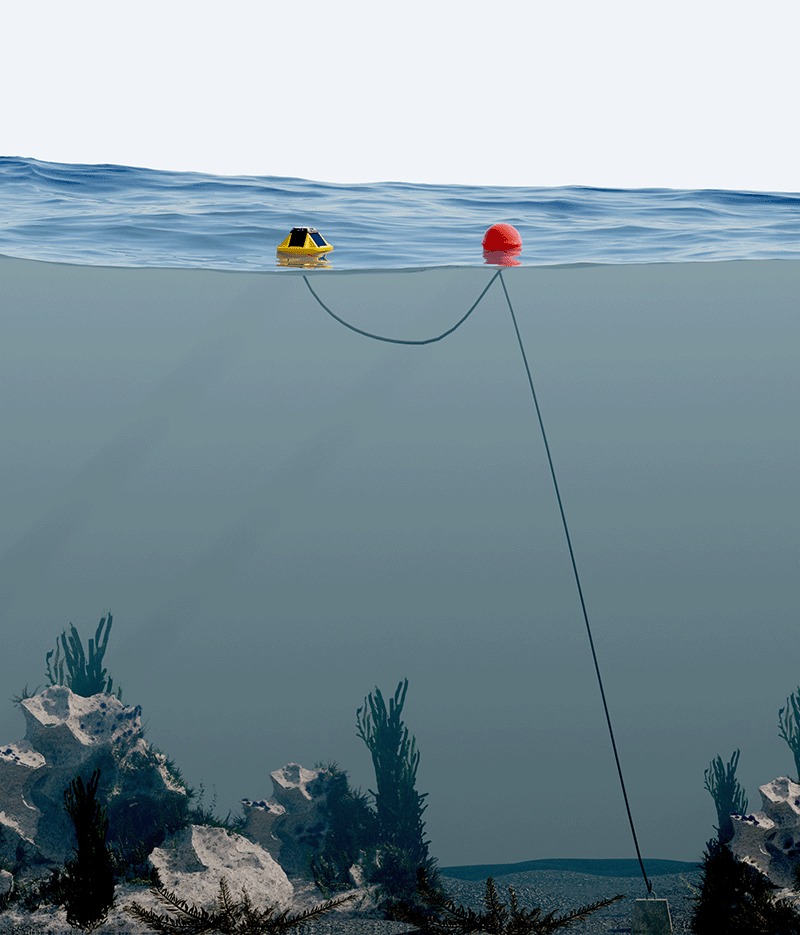
Conventional mooring.
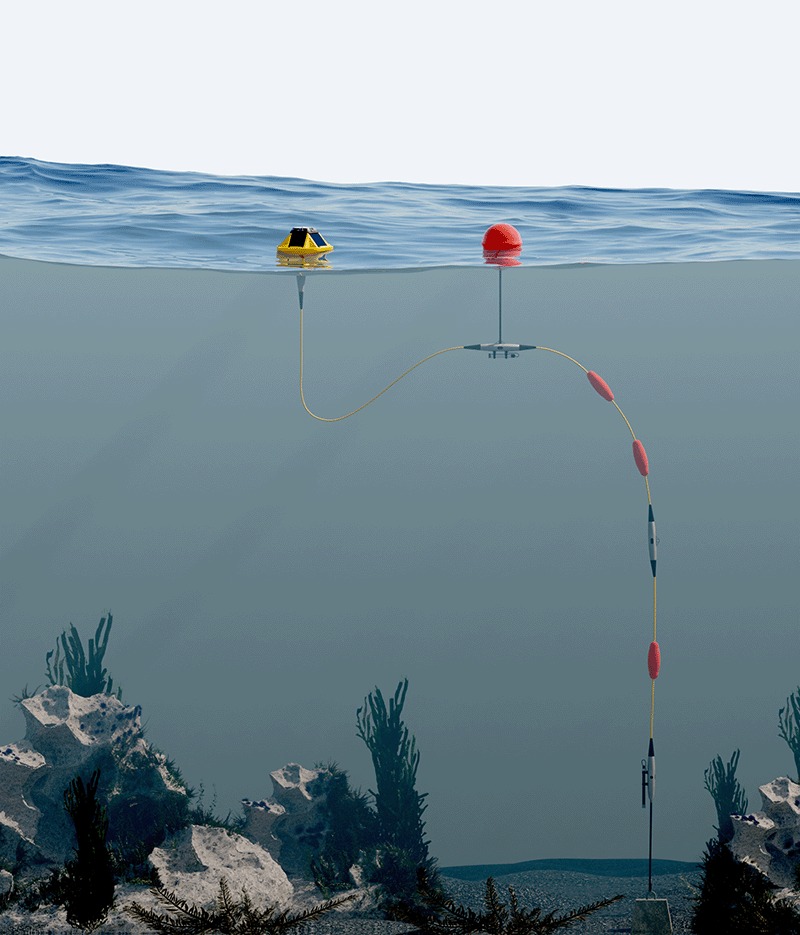
Smart Mooring.
The Spotter page used to end in a Contact sales button. In the 2023–24 redesign I built it in Webflow as three feature modals, Surface, Subsurface and Customizable, and a purchase modal. A researcher could see what Spotter measures, rig a mooring, see sample pricing, and send sales a request that already named the package and the quantity.
Below is a working rebuild of the four modals as one flow, with the 2024 copy, renders and sample prices. The purchase modal was a HubSpot form that I restyled into cards from a Webflow embed. I also moved the site off Gotham and Roboto to Figtree.
I designed the Sofar Approach page in late 2023: a scrolling story of what the company does, set over three looping videos.
We built Spotter.
The ocean we know little about.
Ocean scientists turning data into forecasts.
A relaunch for an open standard
Bristlemouth is an open hardware standard for plugging sensors together in the ocean. I designed the mark and drew the wordmark, the 2023 relaunch of bristlemouth.org, eight logo animations, and the box the Dev Kit shipped in through 2023 and 2024. The animations on the live site are the files I exported.

Plug-and-play sensing, from the 2023 bristlemouth.org relaunch.

The mark, and the wordmark I drew from scratch, on the Dev Kit box.
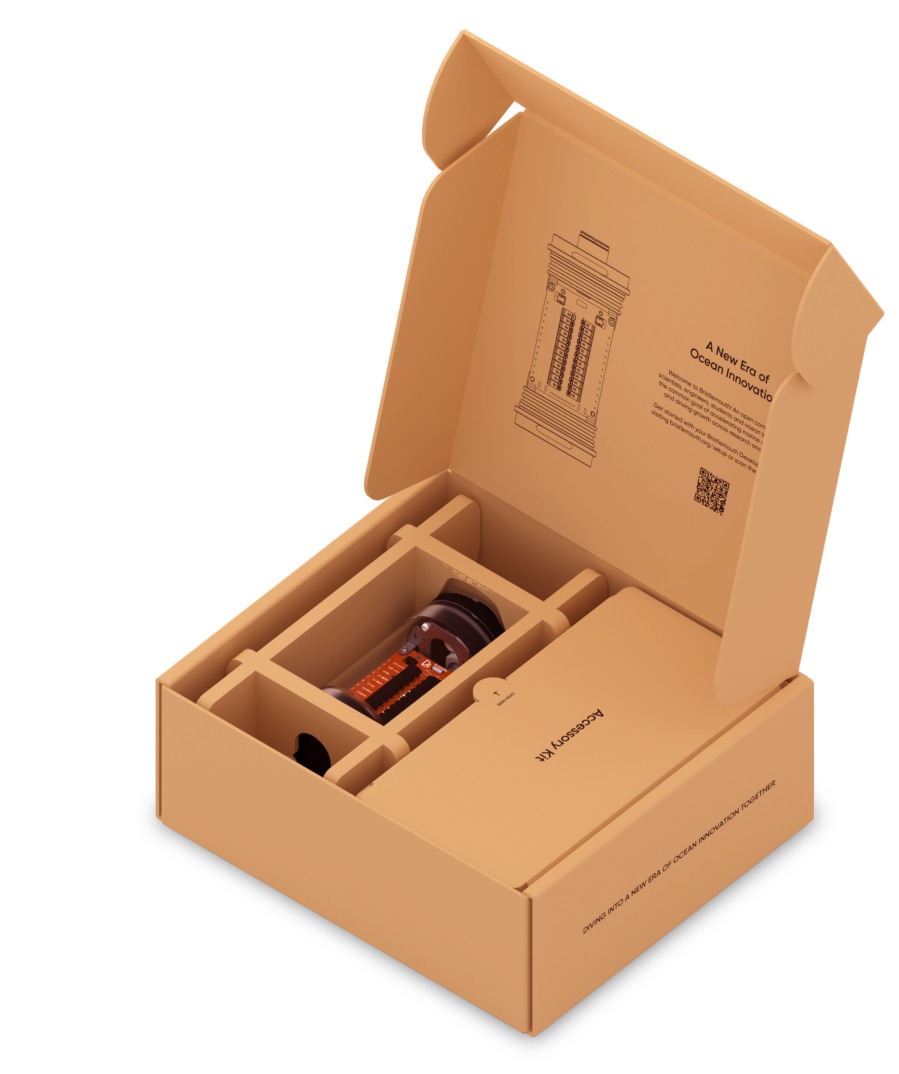
The Dev Kit box, as it shipped.
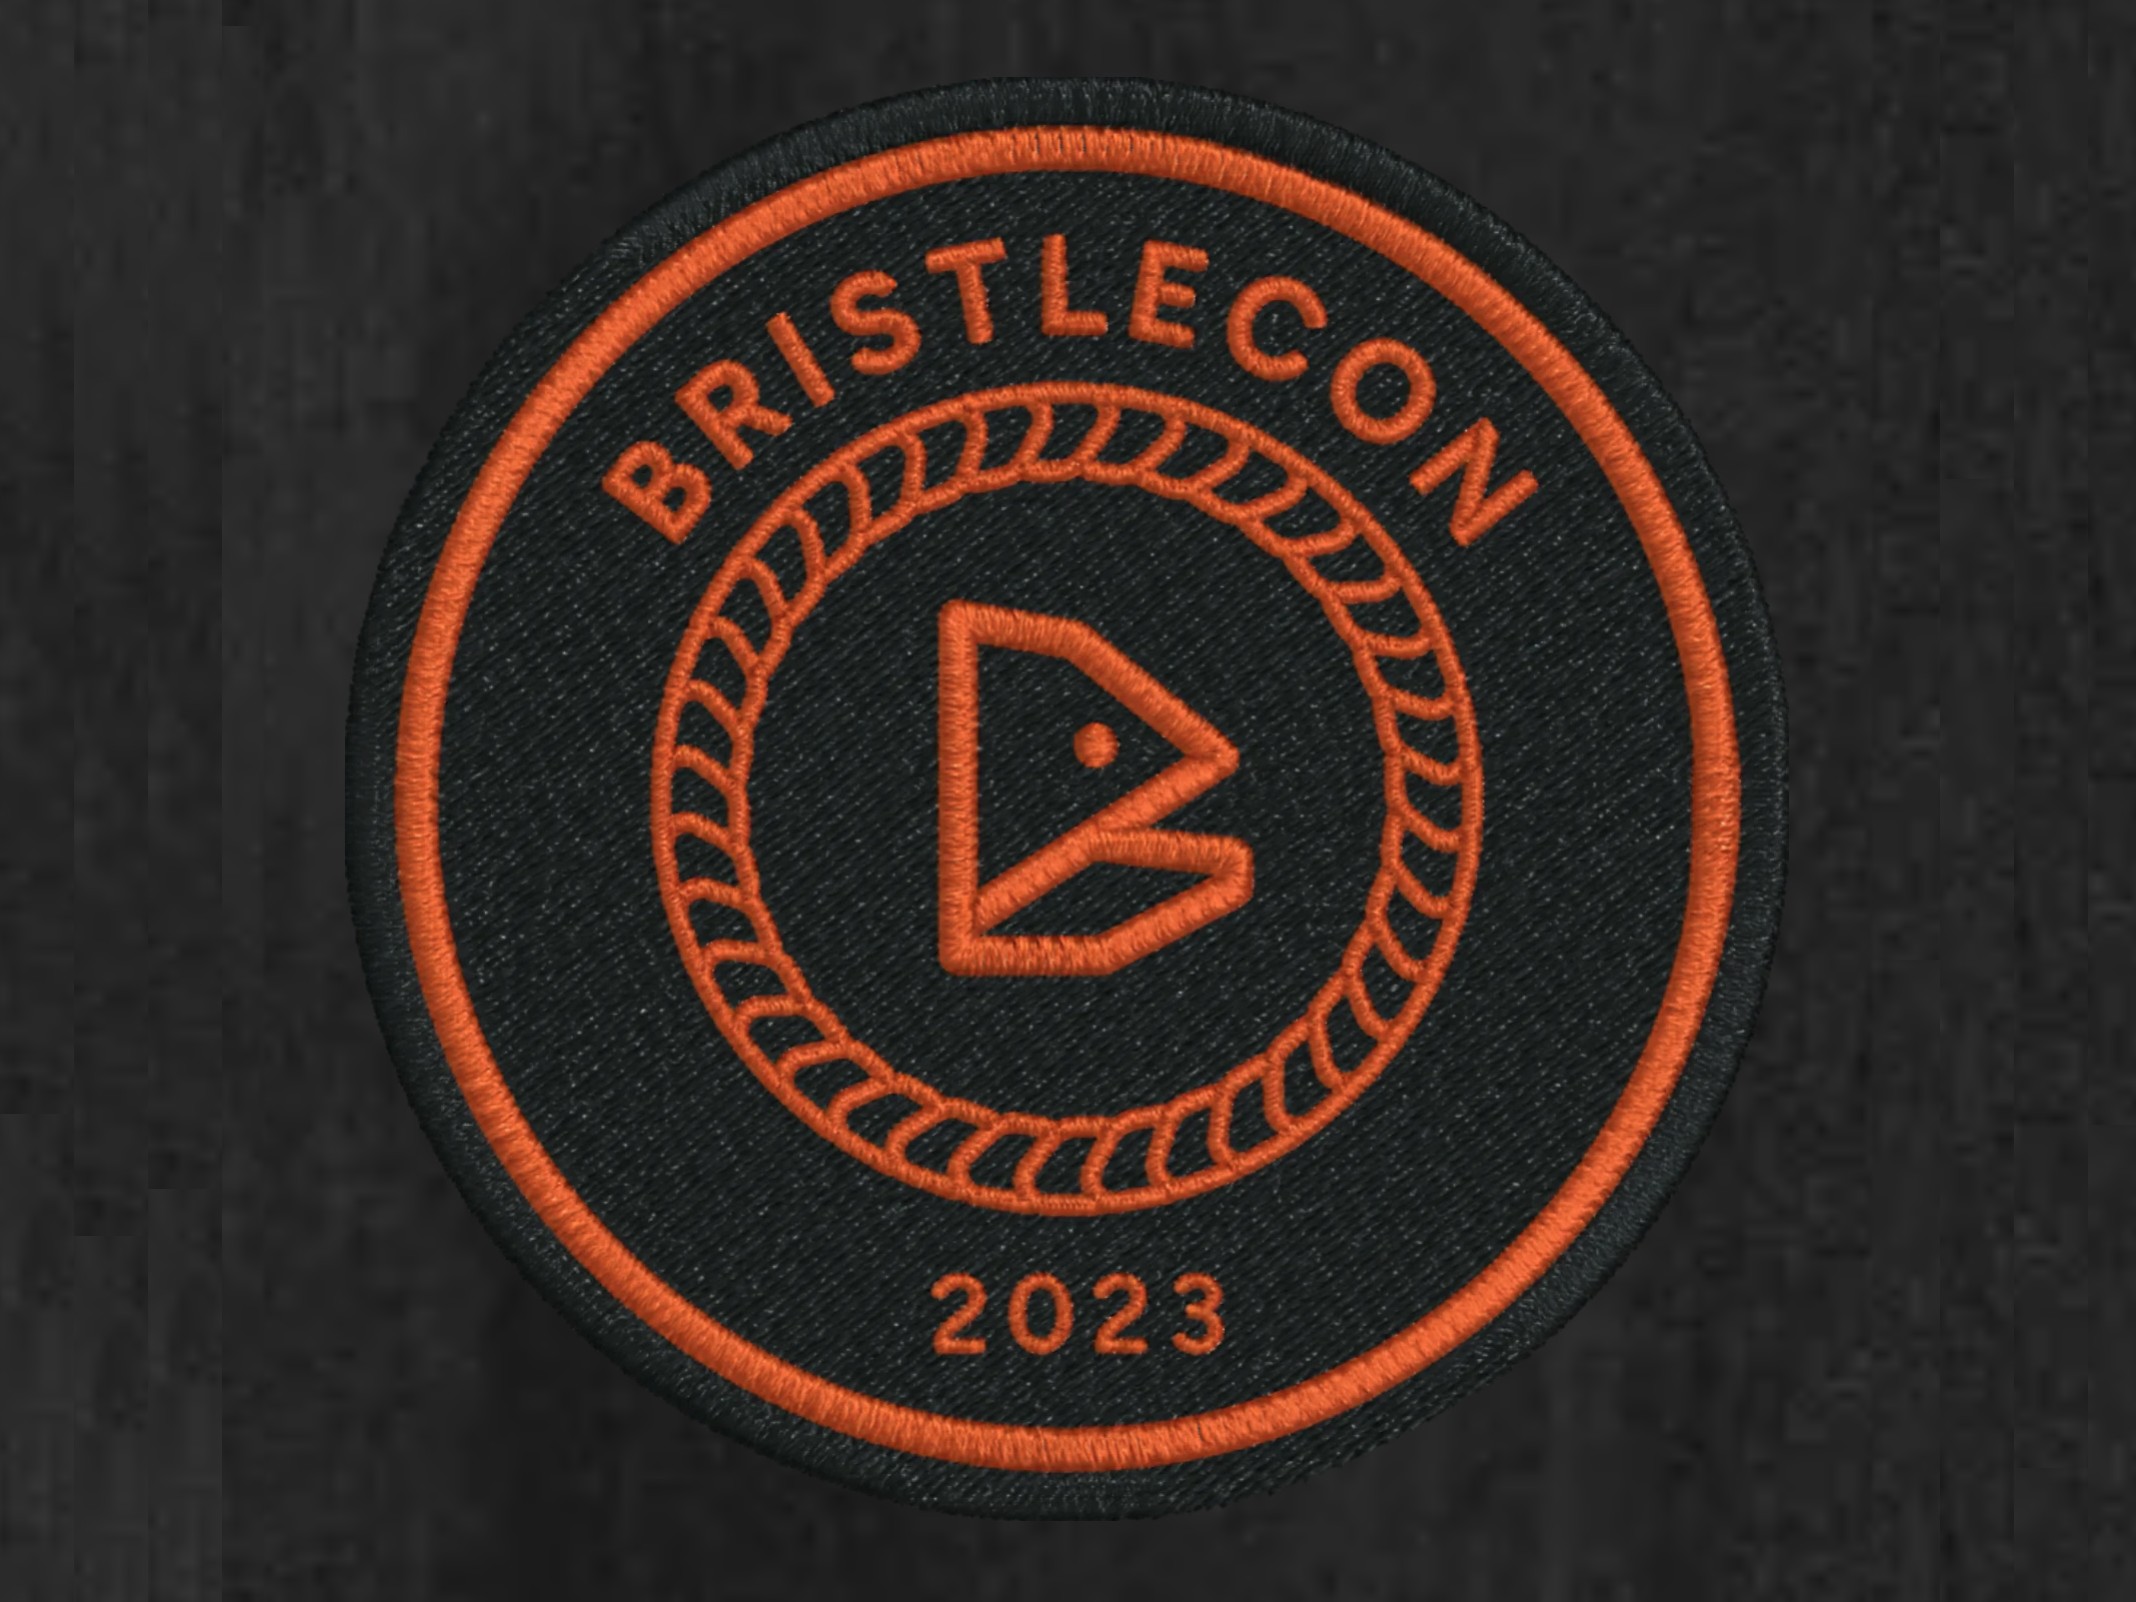
The BristleCon 2023 patch, given to every attendee.
I rebuilt the Bristlemouth circuit board by hand in Blender, so the hardware could be shown at any angle. For BristleCon, the 2023 Bristlemouth conference, I ran the whole visual identity, then filmed and edited the talks.
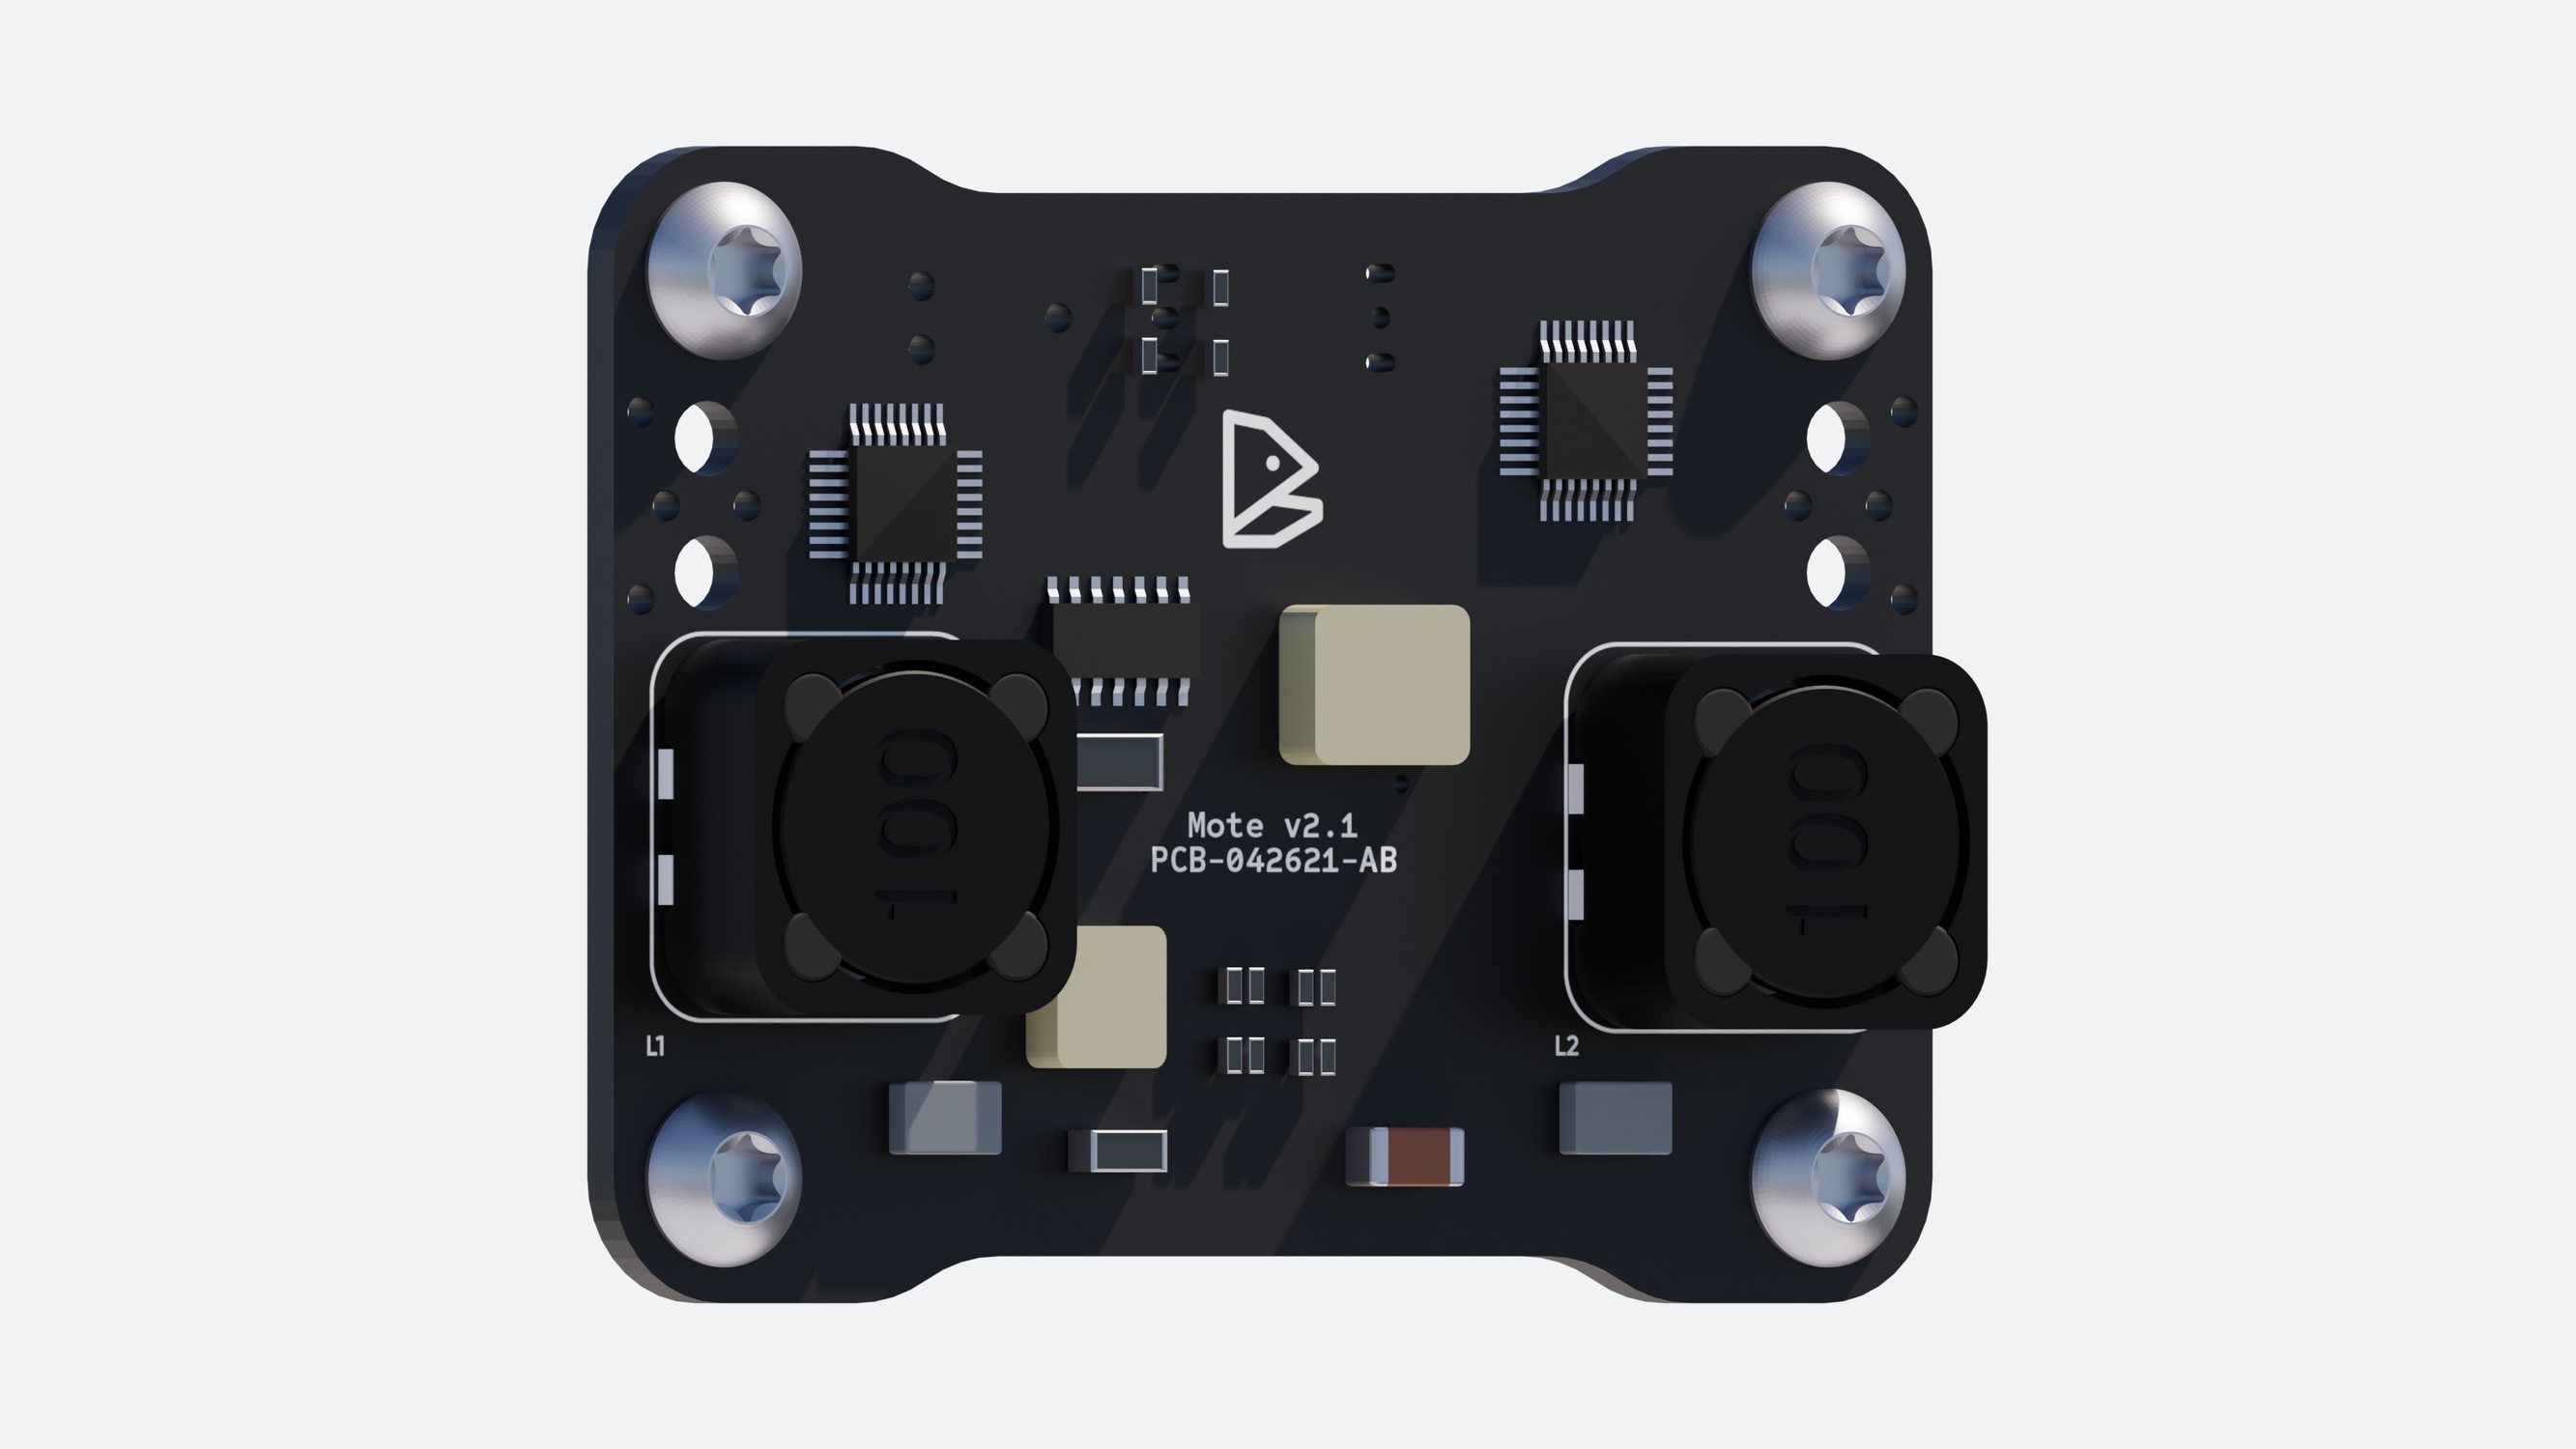
The board, modelled by hand.
Decks, one-pagers and white papers
I built Sofar's company Google Slides template and about 20 decks on it. The files stayed with Sofar. These slides are from a webinar that is still on YouTube.
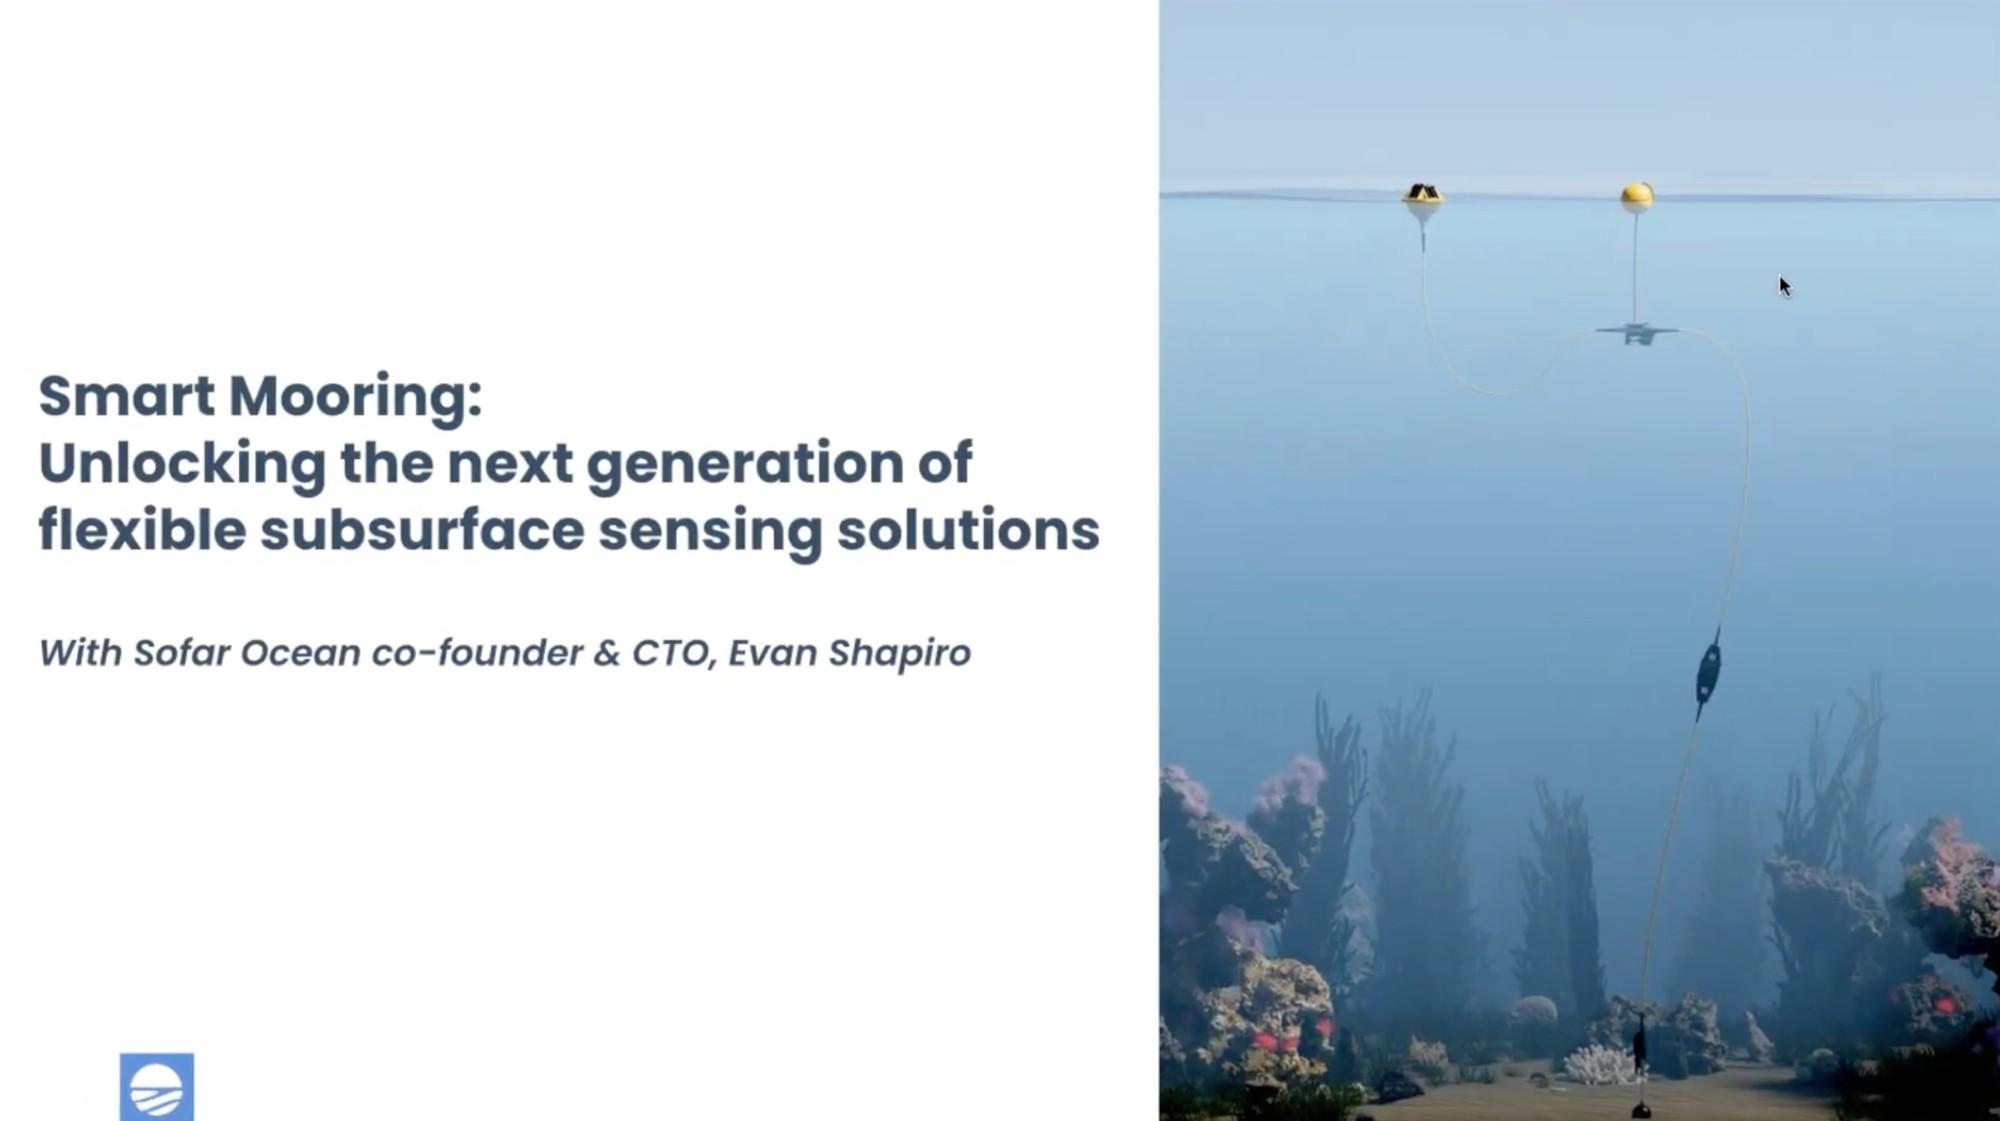
Smart Mooring webinar, title slide.
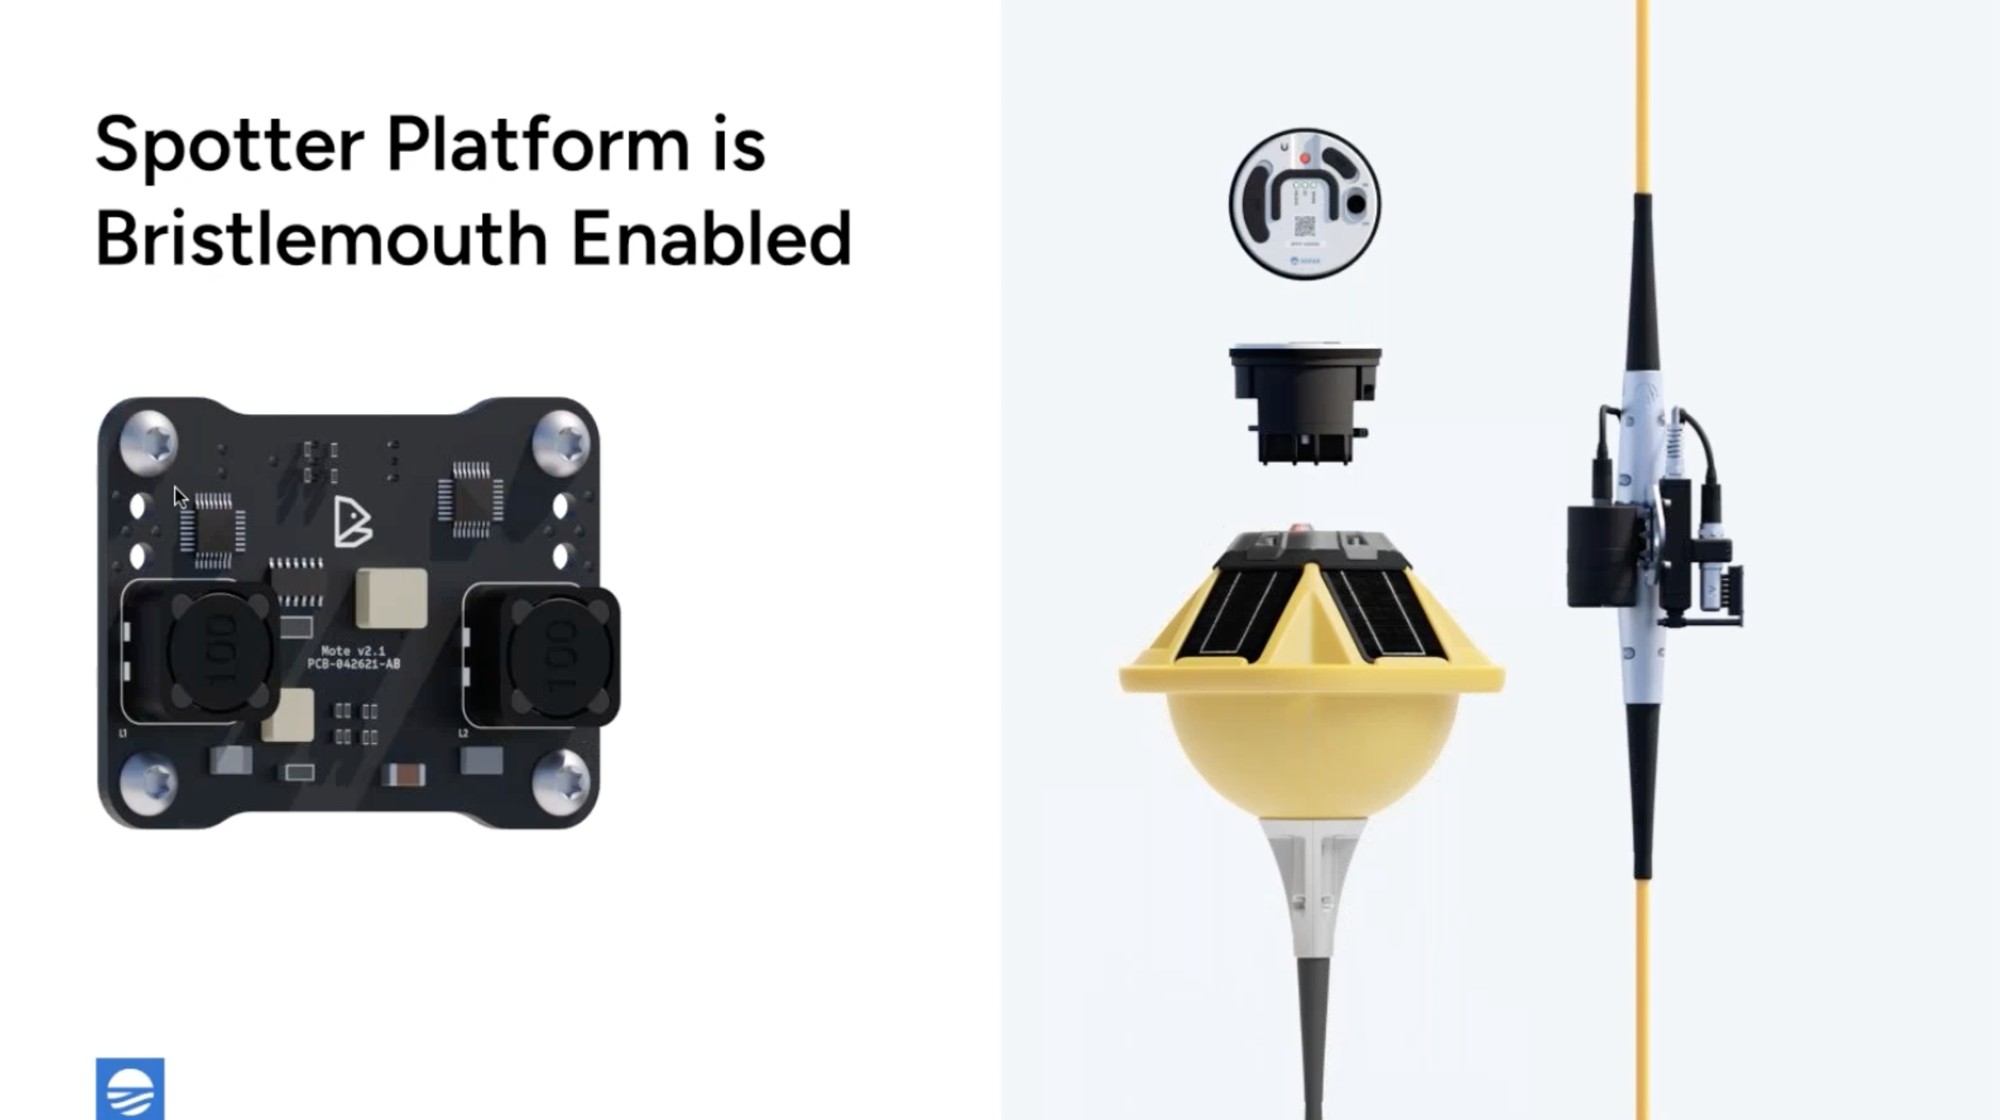
Same webinar. The exploded Spotter and the board are my renders.
I designed Sofar's product one-pagers, including Smart Mooring in 2022 and the two-page Wayfinder sheet in 2023.

Smart Mooring, November 2022.

Wayfinder, 2023, page one.

Page two.
I designed the Spotter User Guide, the booklet that walks a new owner from unboxing to deployment. Sofar still publishes my design.
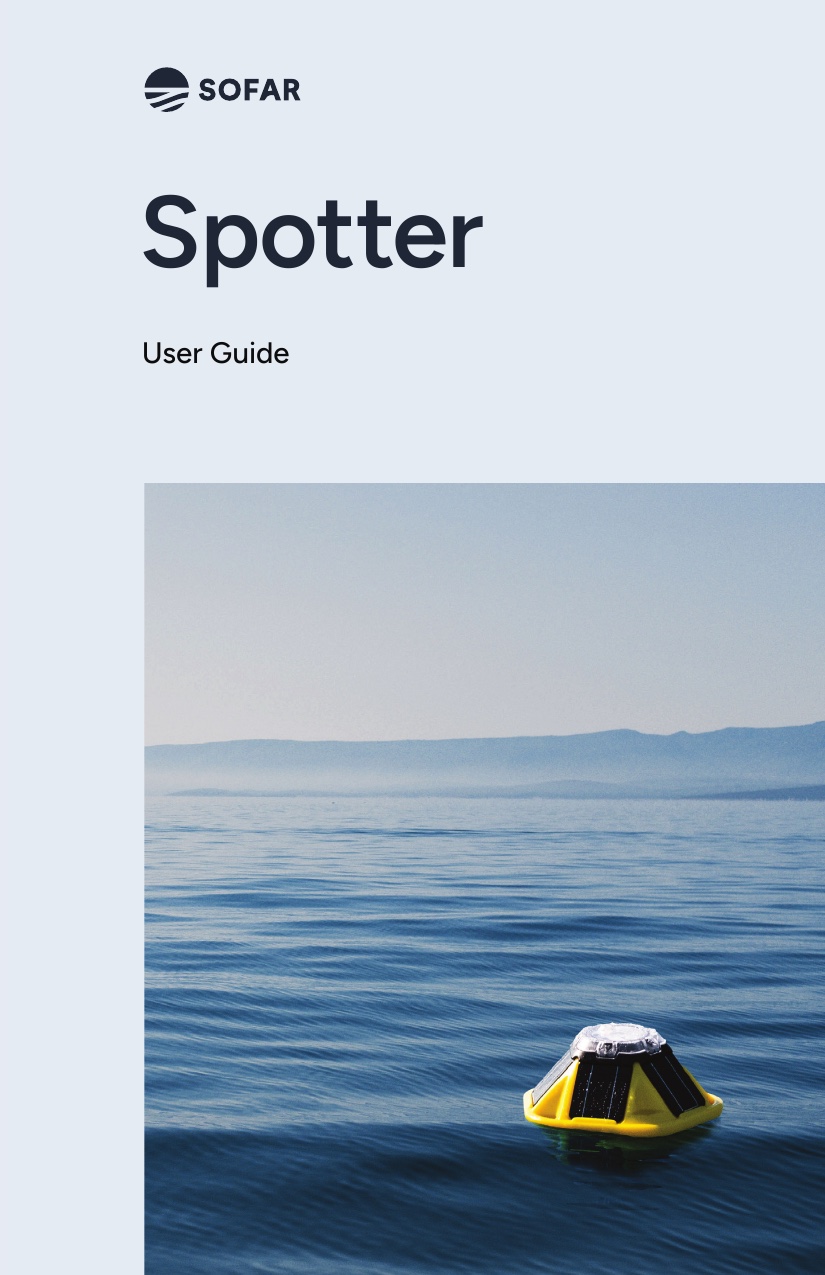
The cover.
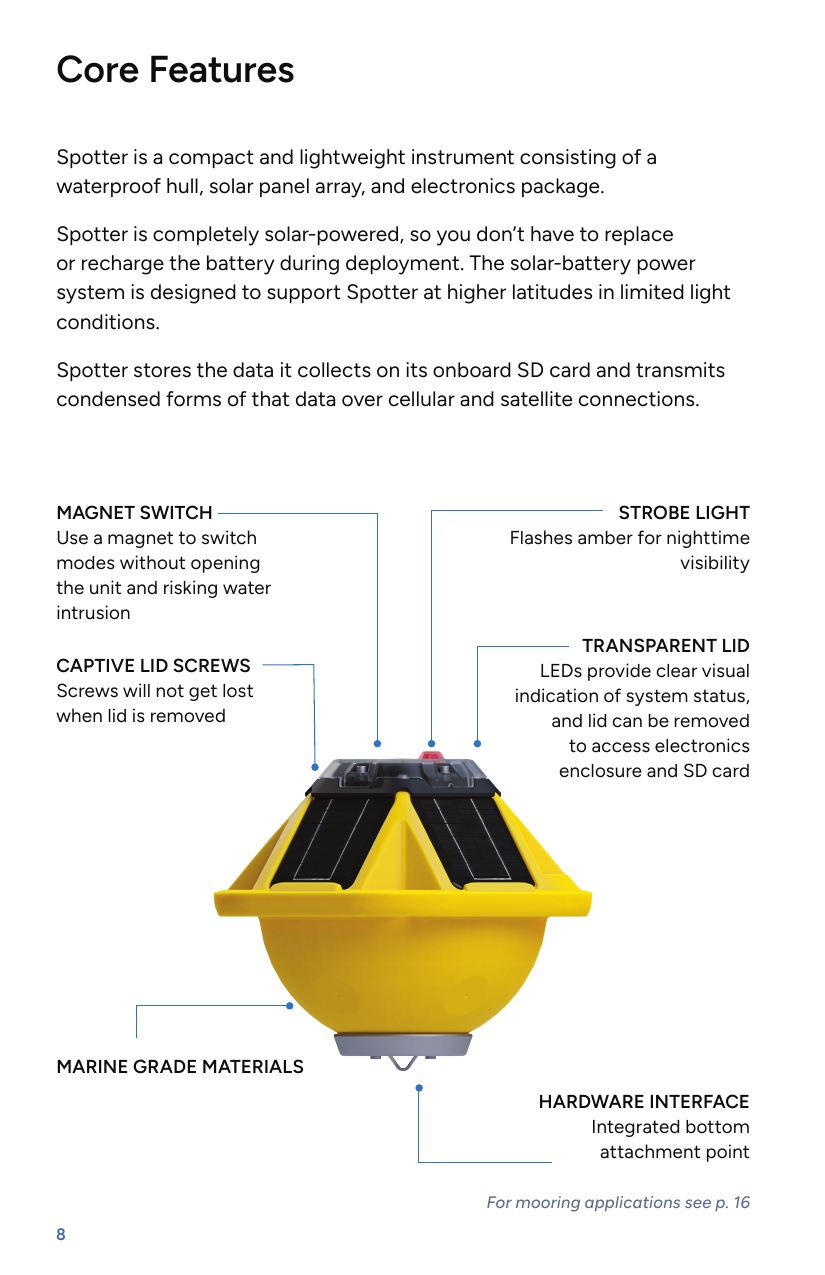
Core features.
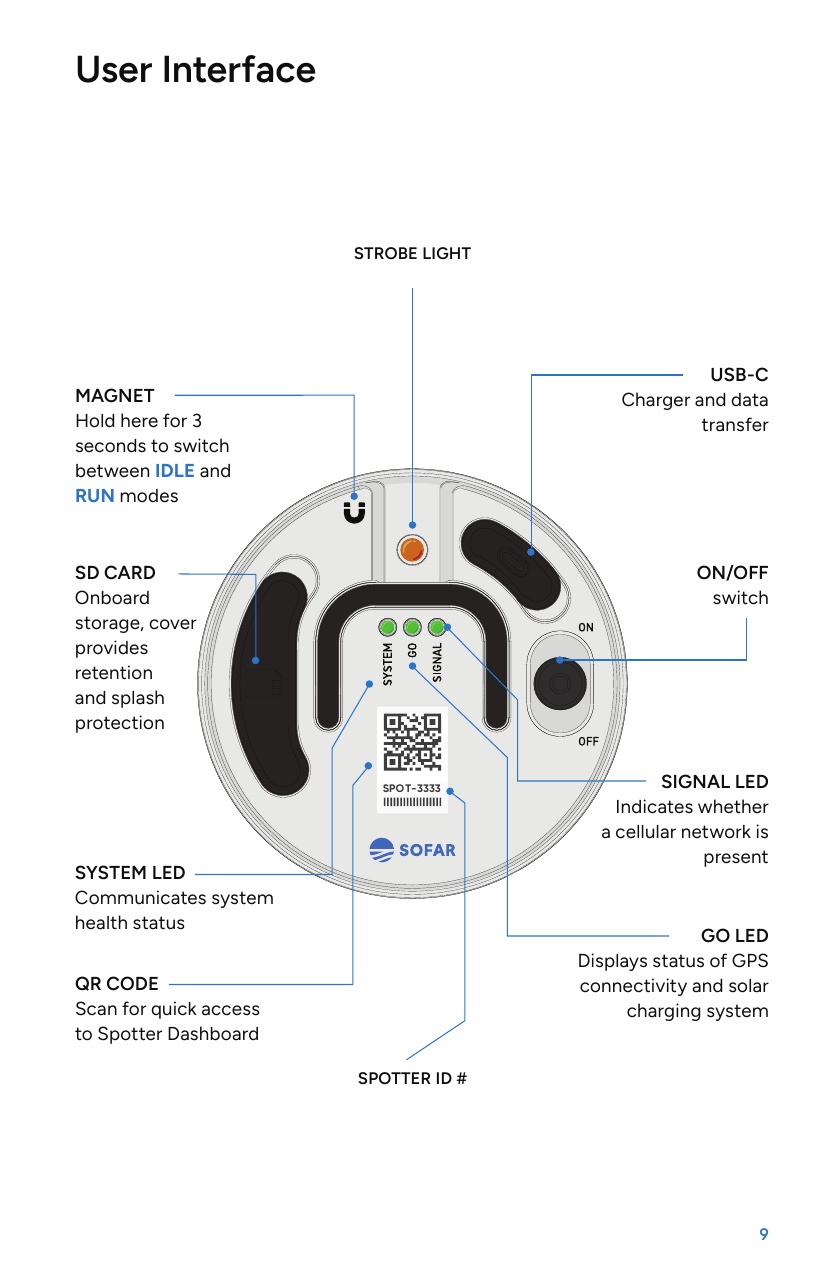
The lid diagram, which I drew in Illustrator.
I laid out Sofar's two Wayfinder white papers and drew their diagrams and icons. The writing was the team's.
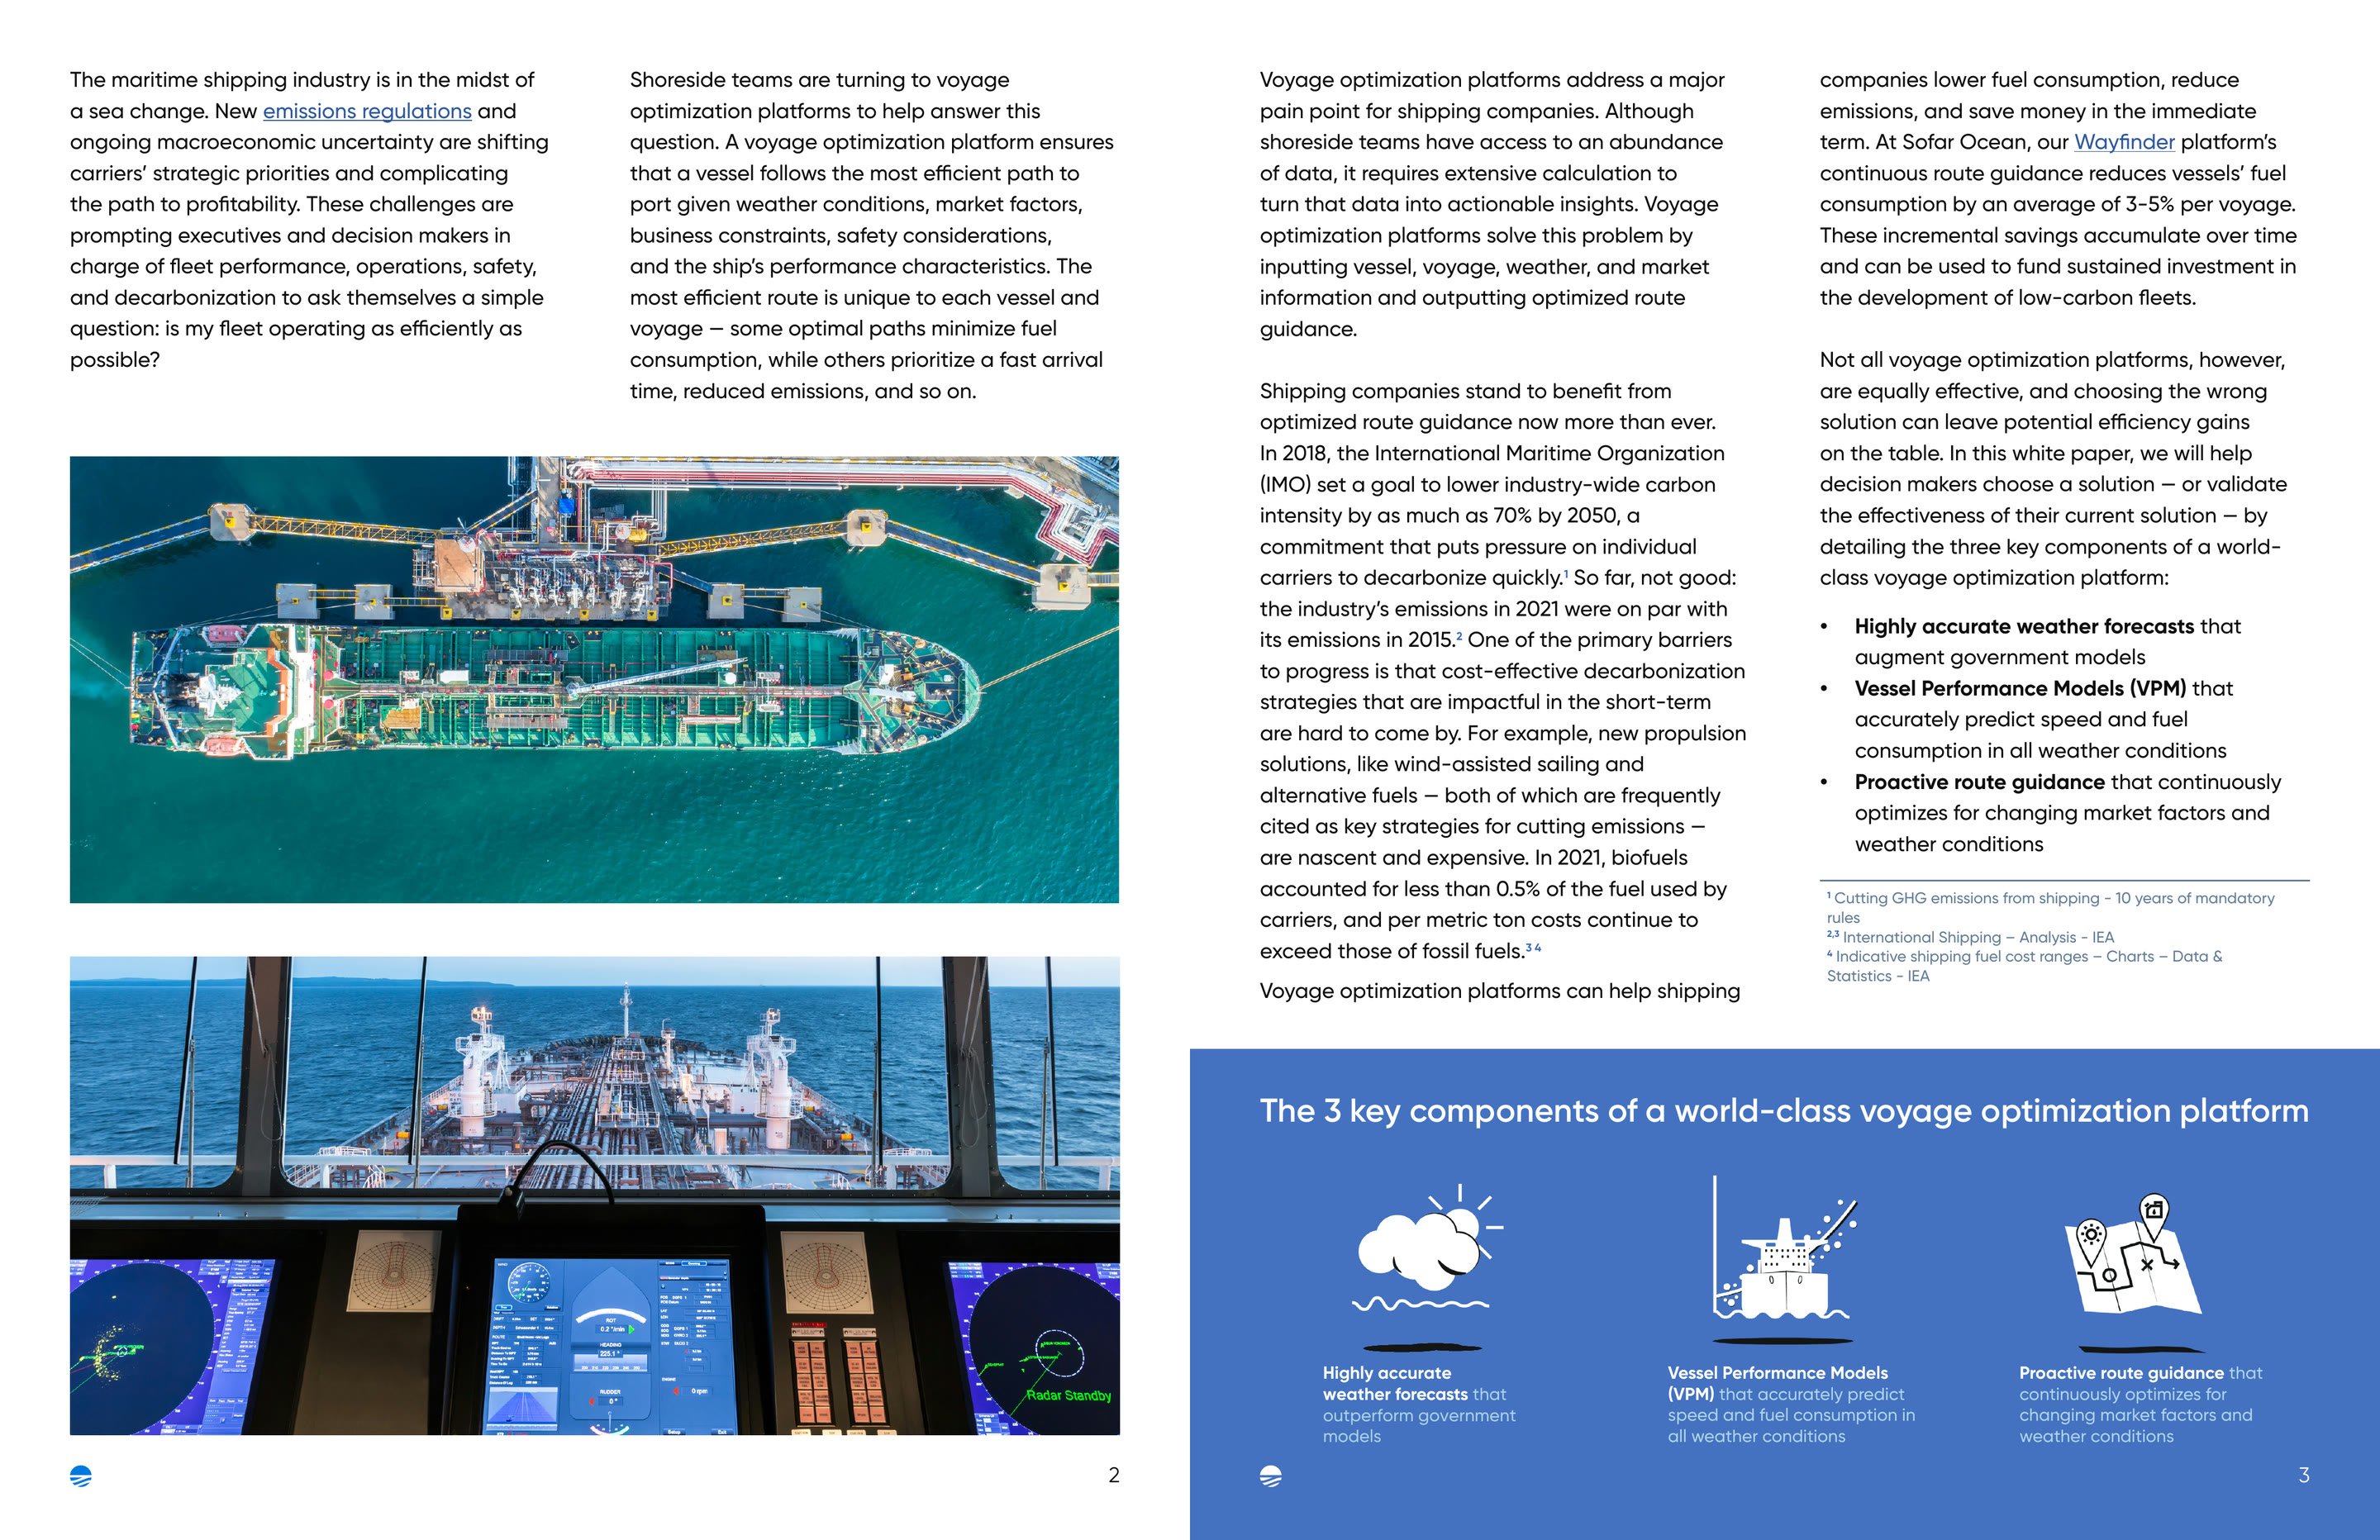
Voyage optimization, April 2023.
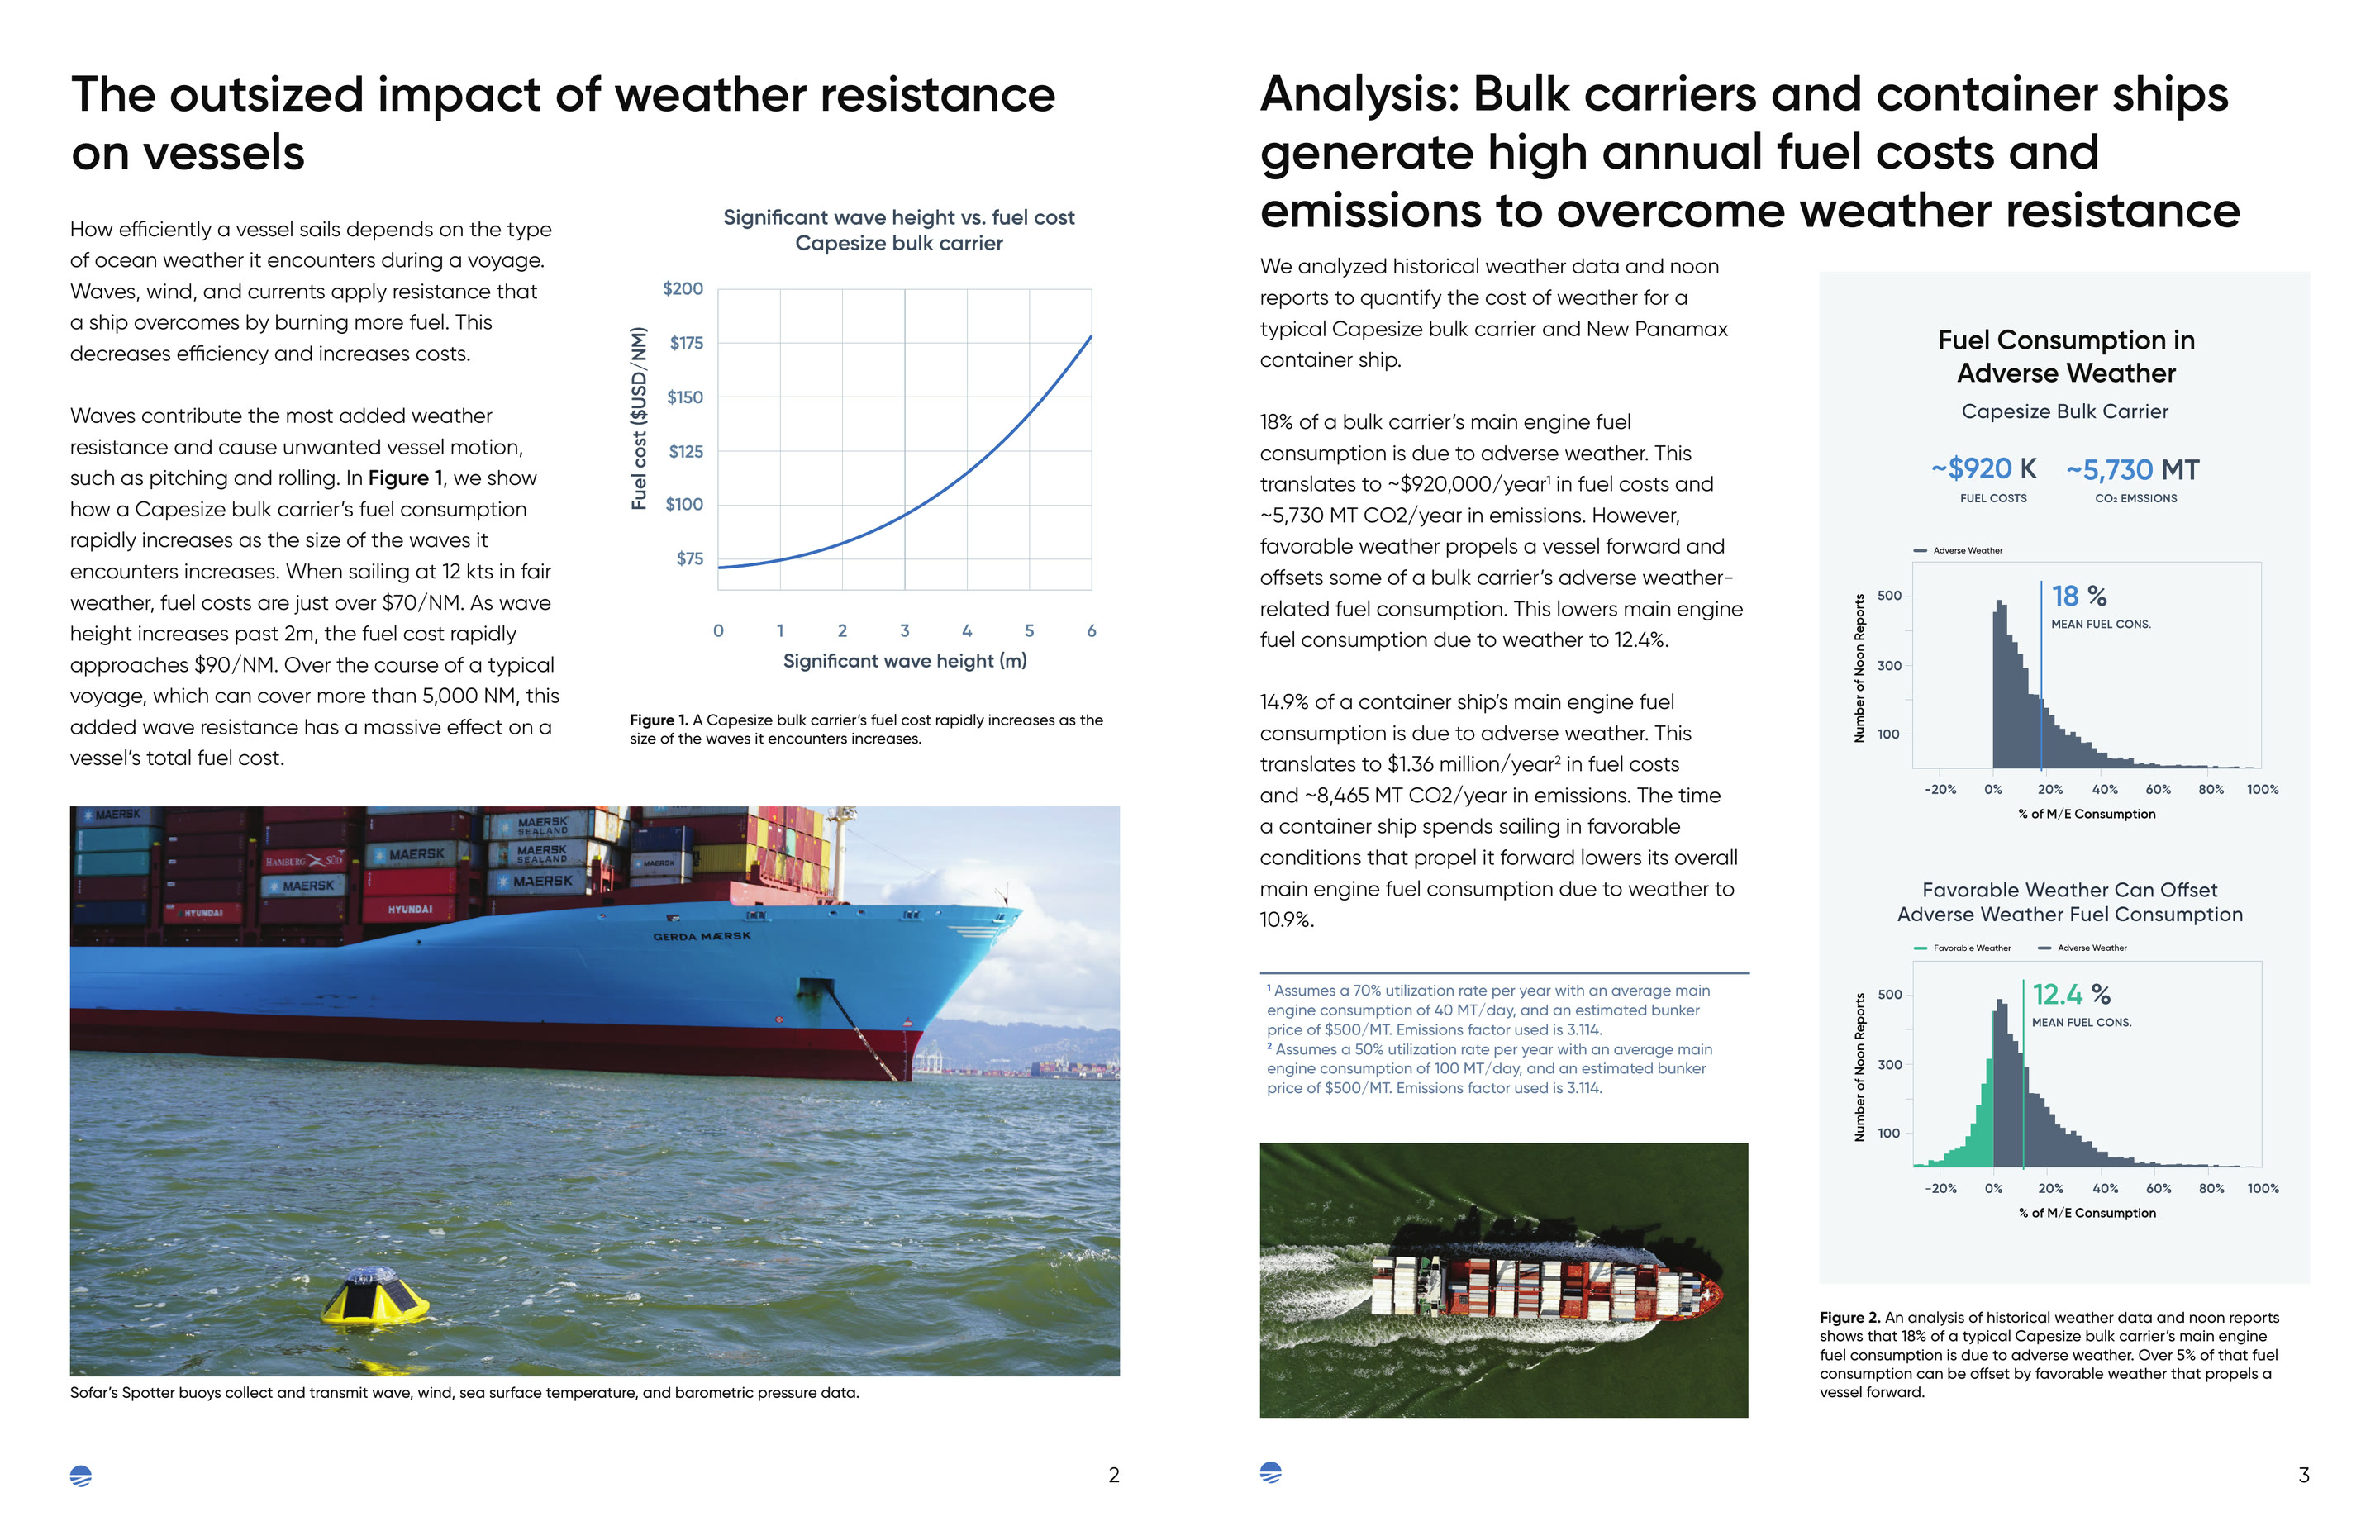
The cost of weather, July 2023.
Film and 3D for sensors you'll never see
Most buyers never see a Spotter at sea, so I made two films that show one working. I picked the camera (a Sony FX3, which Sofar bought on my recommendation), shot and lit the interviews, sourced the b-roll, built every 3D render and animation, then edited, graded and mixed both.
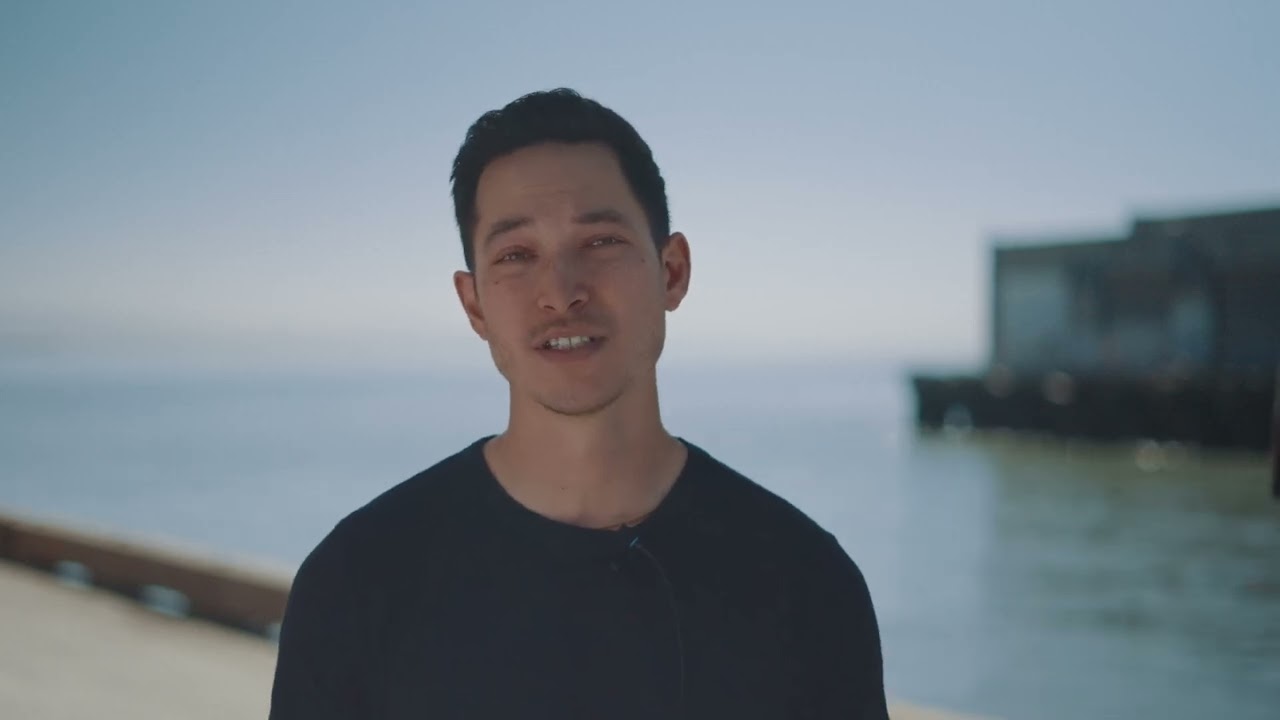
Subsurface current measurement.
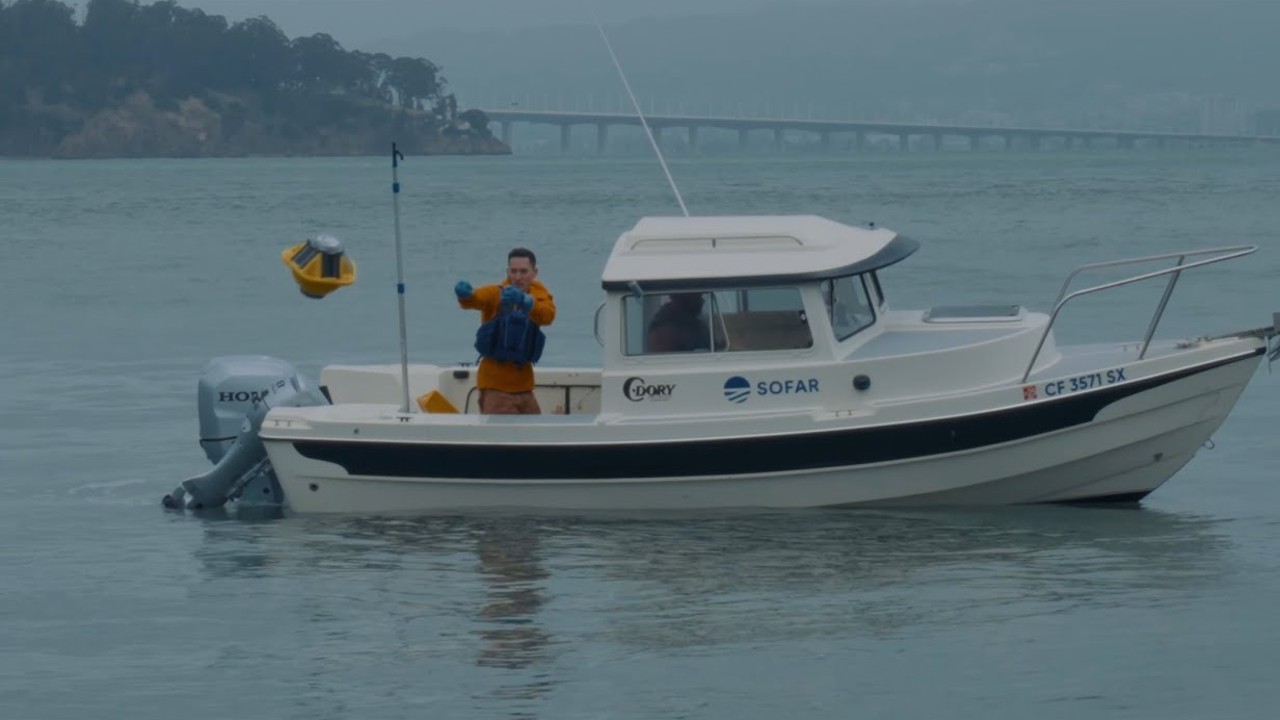
The Spotter Platform.
I also shot and edited Sofar's explainer series, An Ocean Scientist Explains, and made its motion graphics.
My motion graphics in the vessel performance episode, at 3:59 in the full video.
The vessel performance curve, from my source animation.
Water flow around the hull, simulated in Blender for the same episode.

The Carbon Intensity Indicator episode.
I built Sofar's ocean cutaways and Spotter renders in Blender, including the cutaways that show what sits under the surface and the exploded views in the webinar decks.
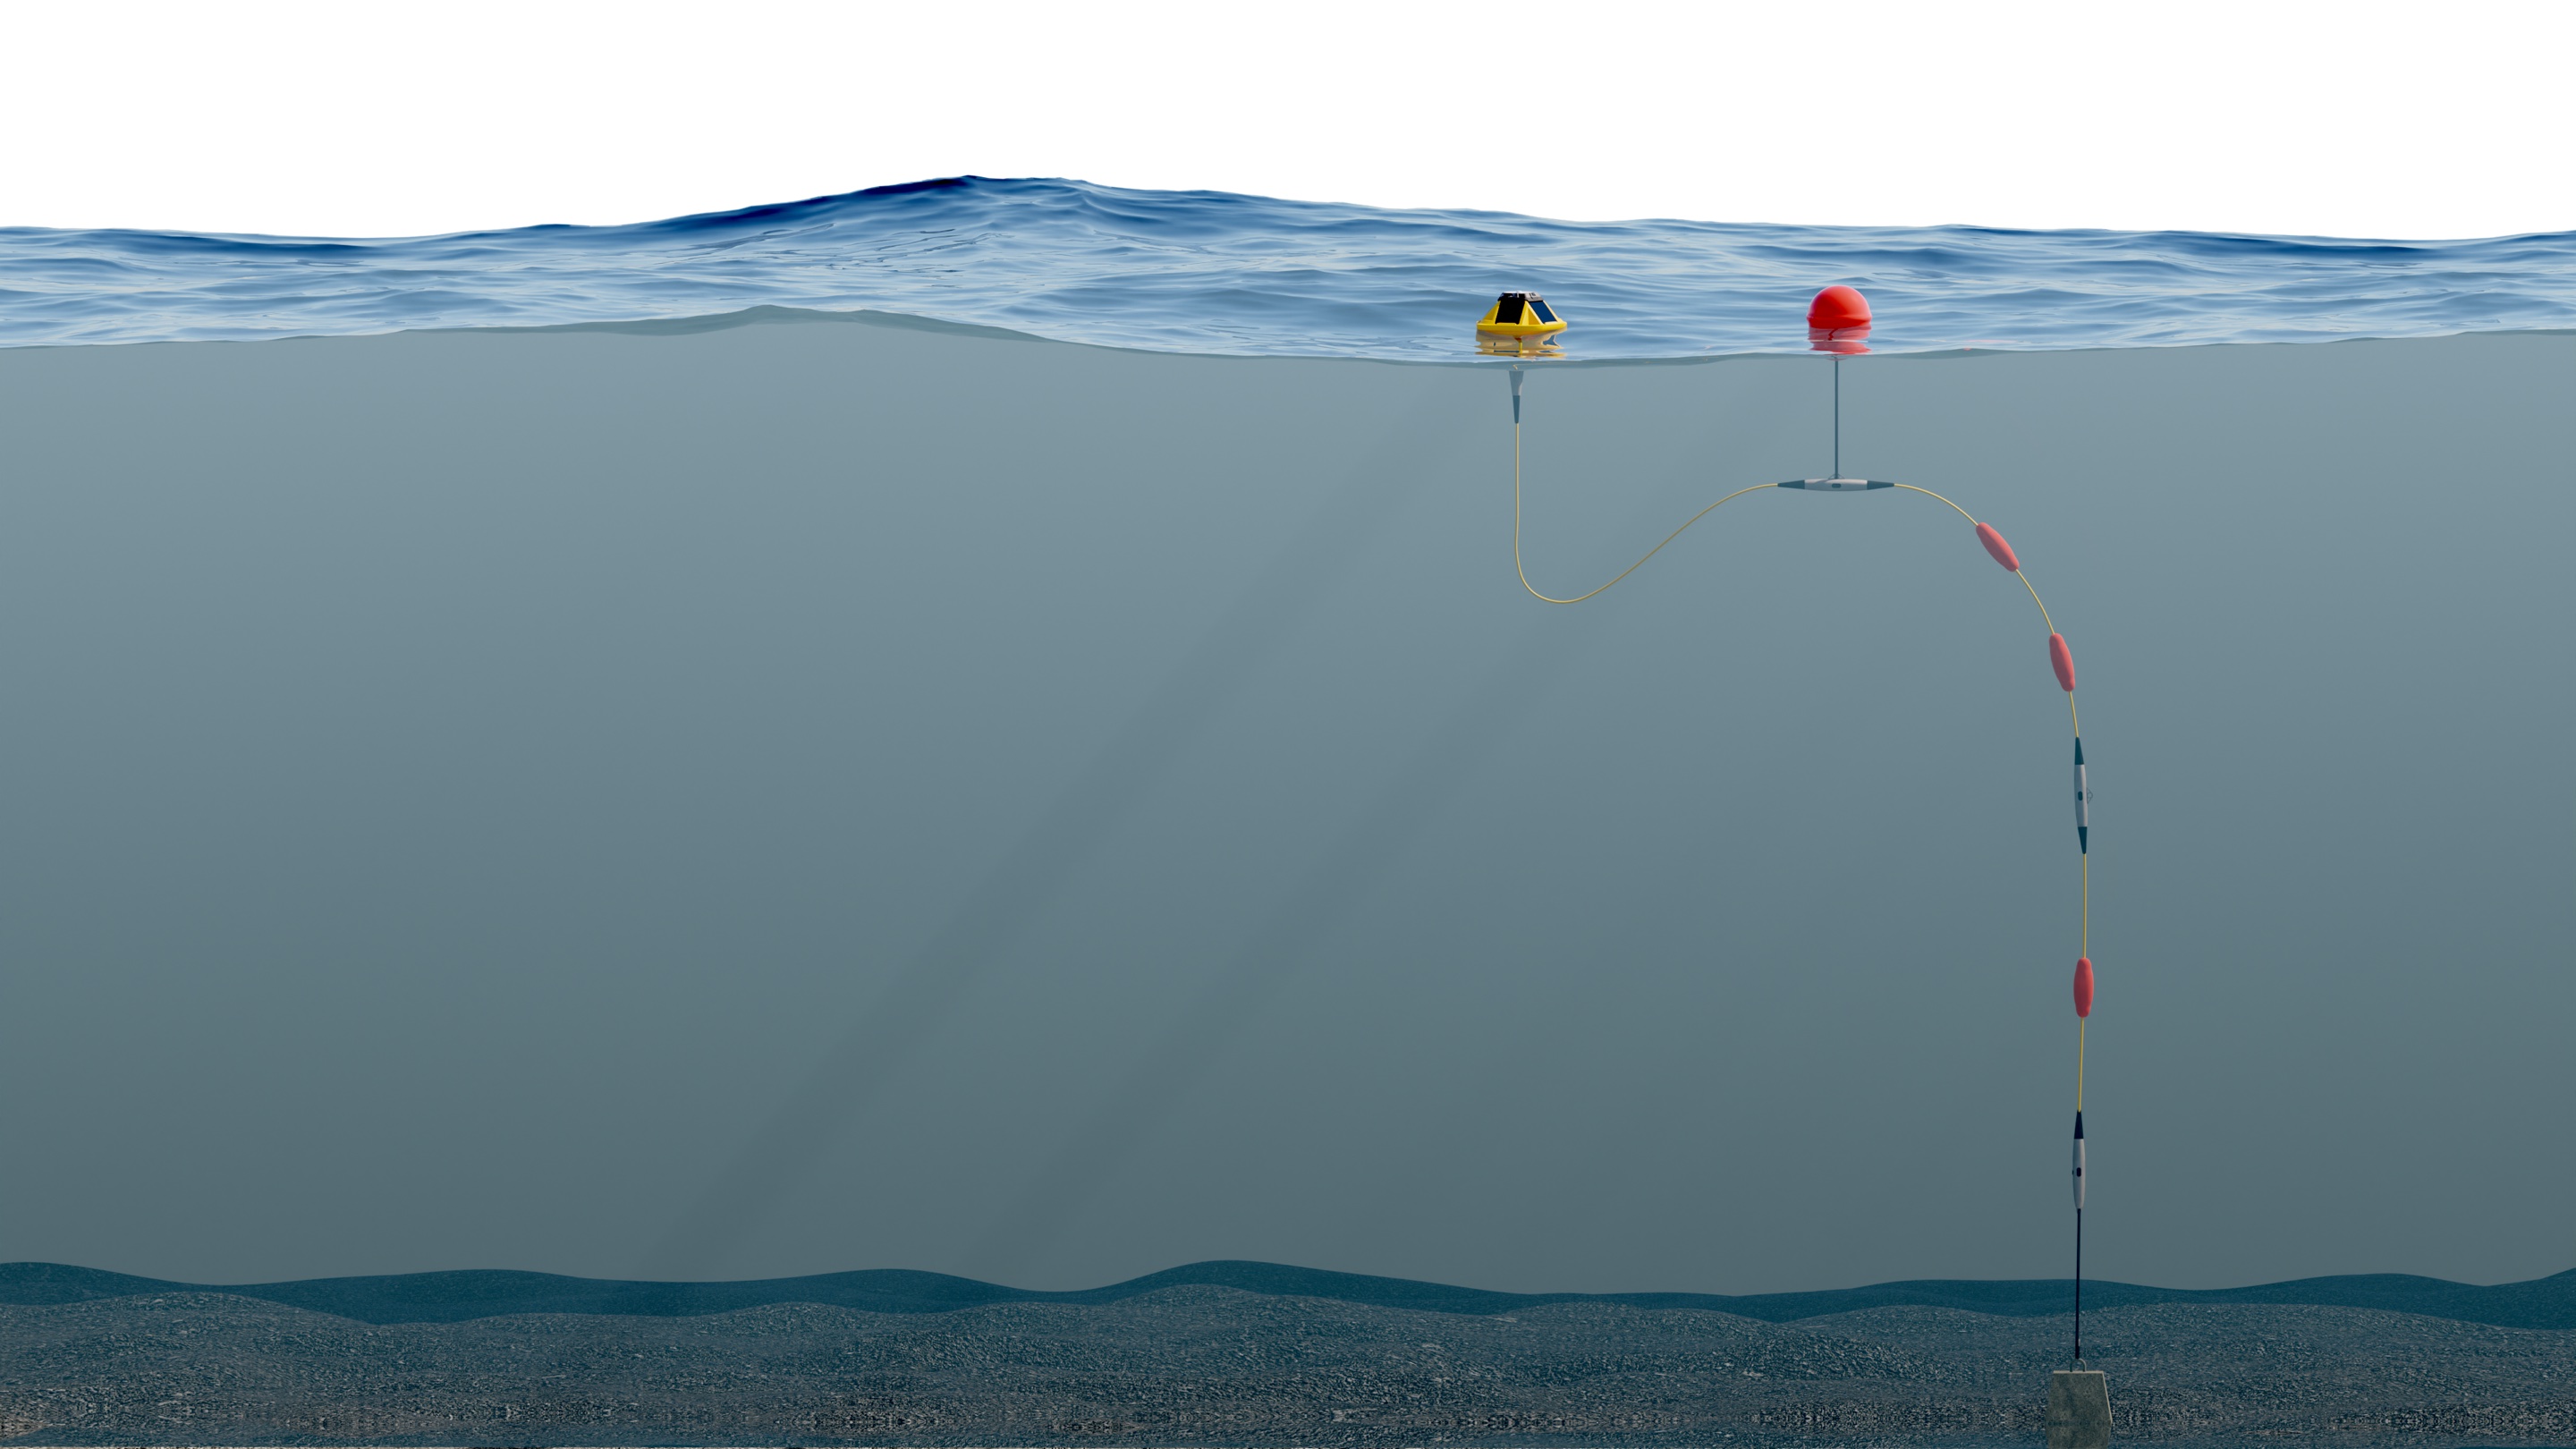
A Smart Mooring cutaway.
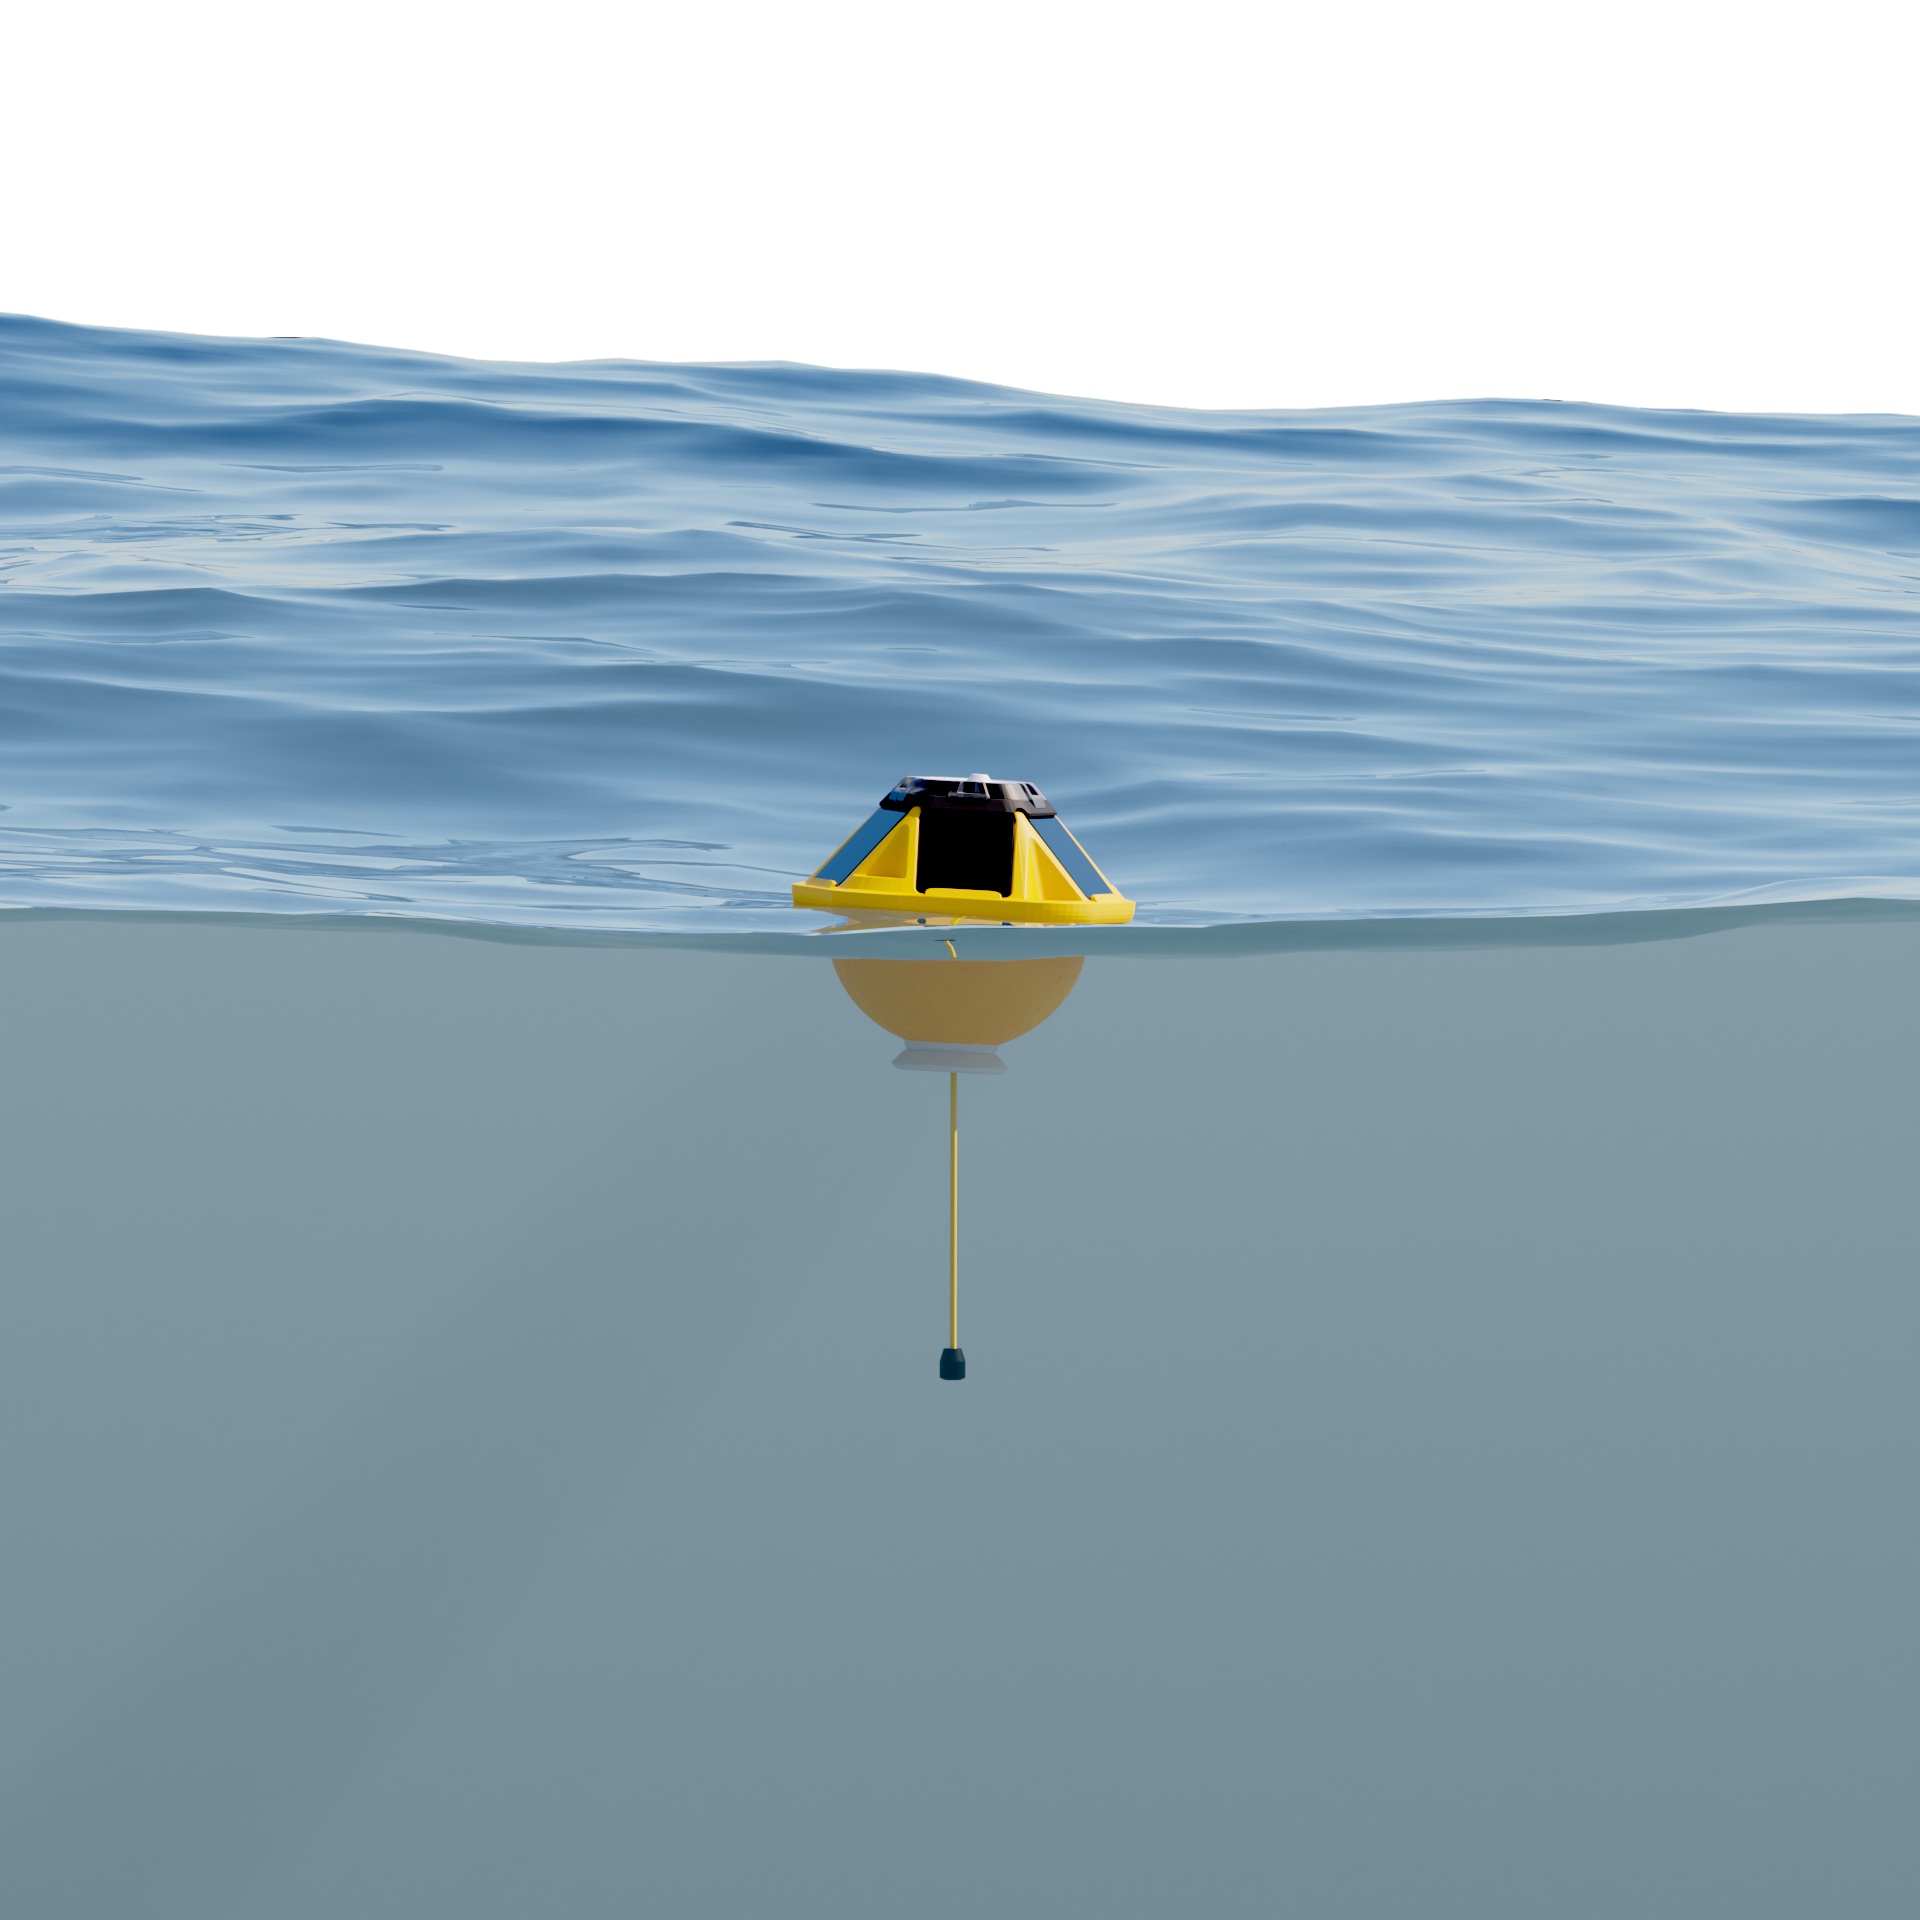
Spotter with a hydrophone, ocean cutaway.
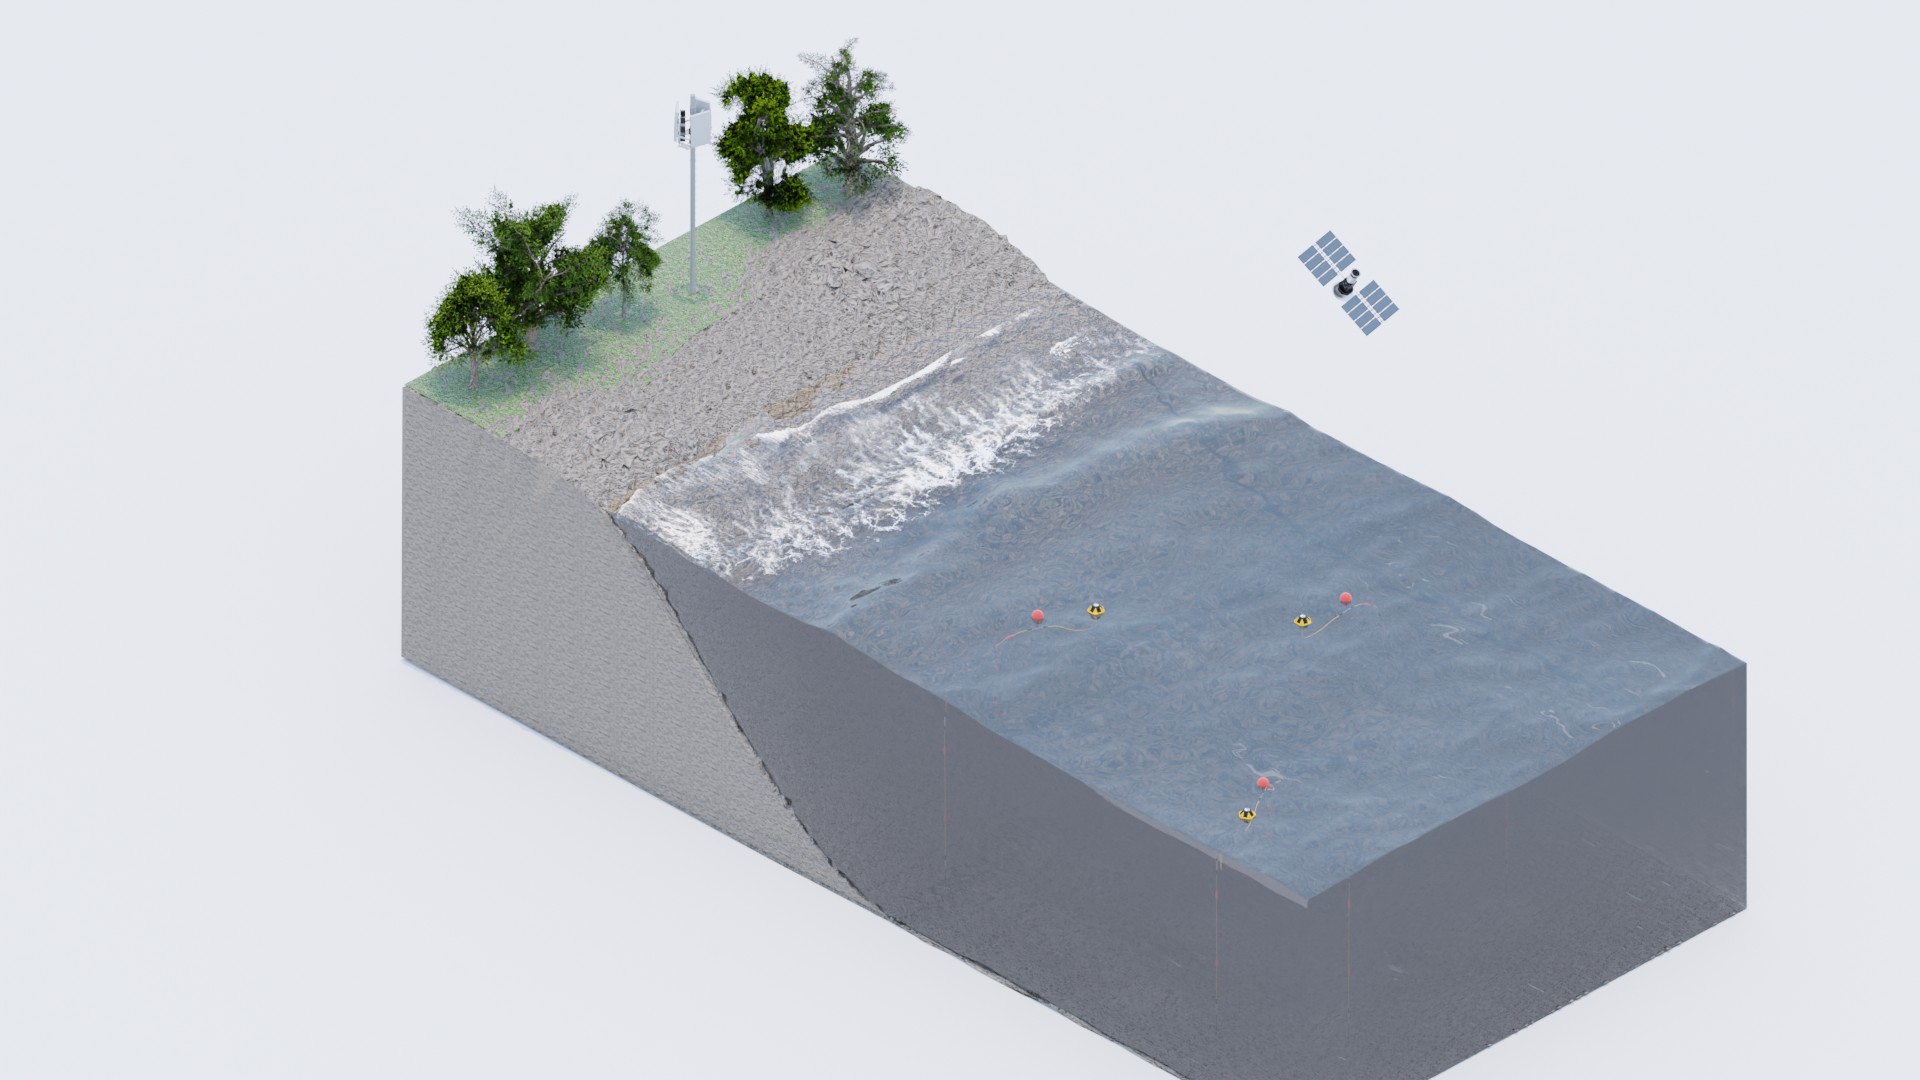
A coastal cutaway: buoys offshore, cell coverage from land.
Spotter coming apart and turning to x-ray, from the Spotter Platform film.

Spotter from above, from my Blender model.
Booth graphics for three ocean-industry trade shows, quick-turn motion for five Atlantic storms dropping Spotters into the storm paths, and merch.
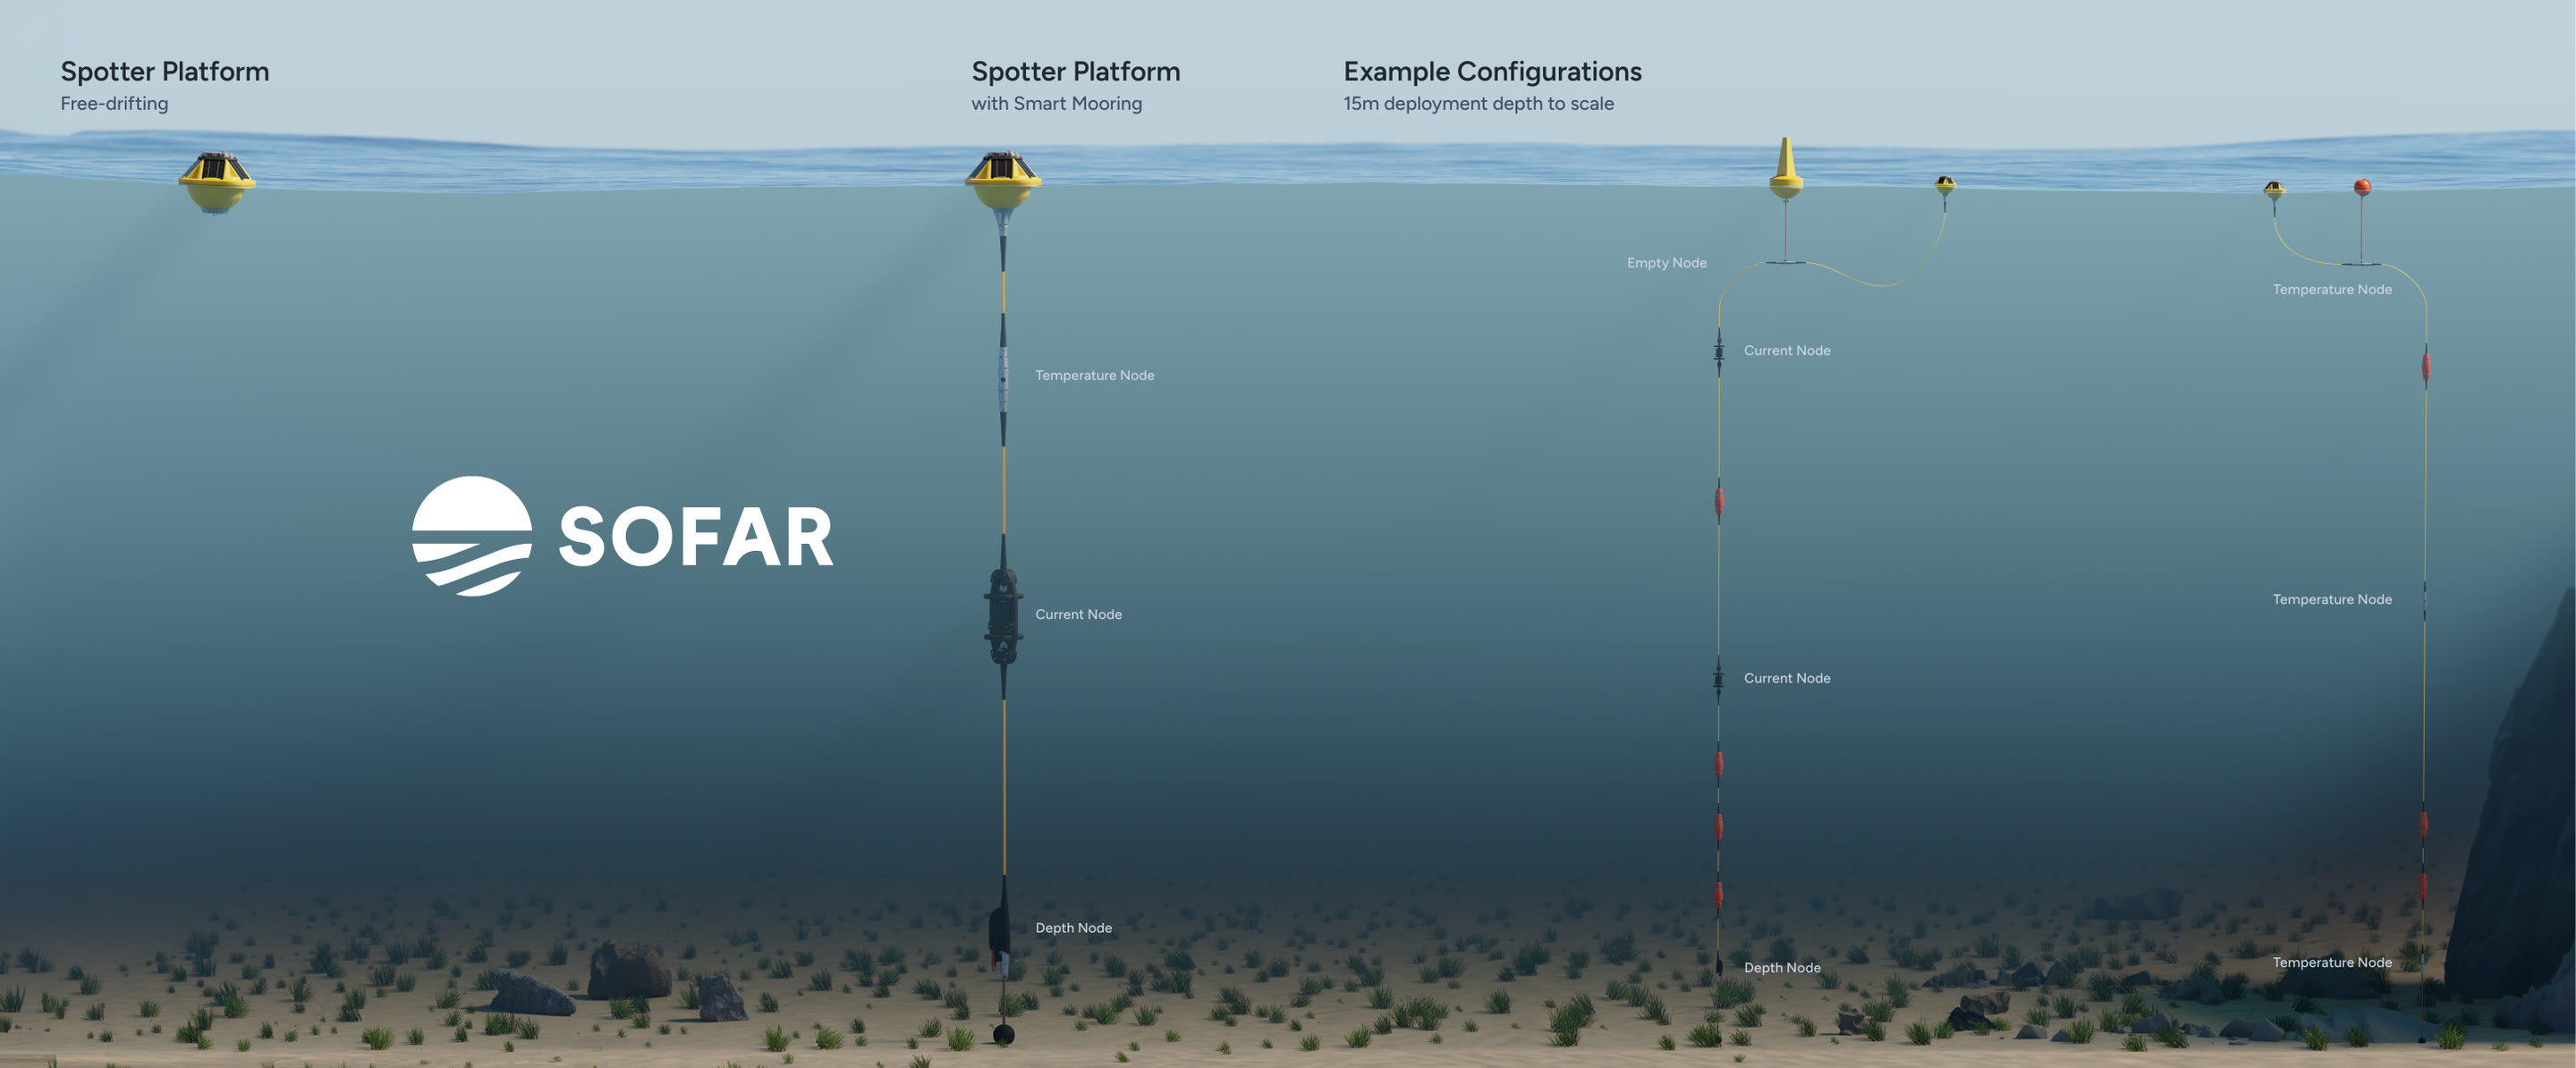
Oceanology International, 2024.
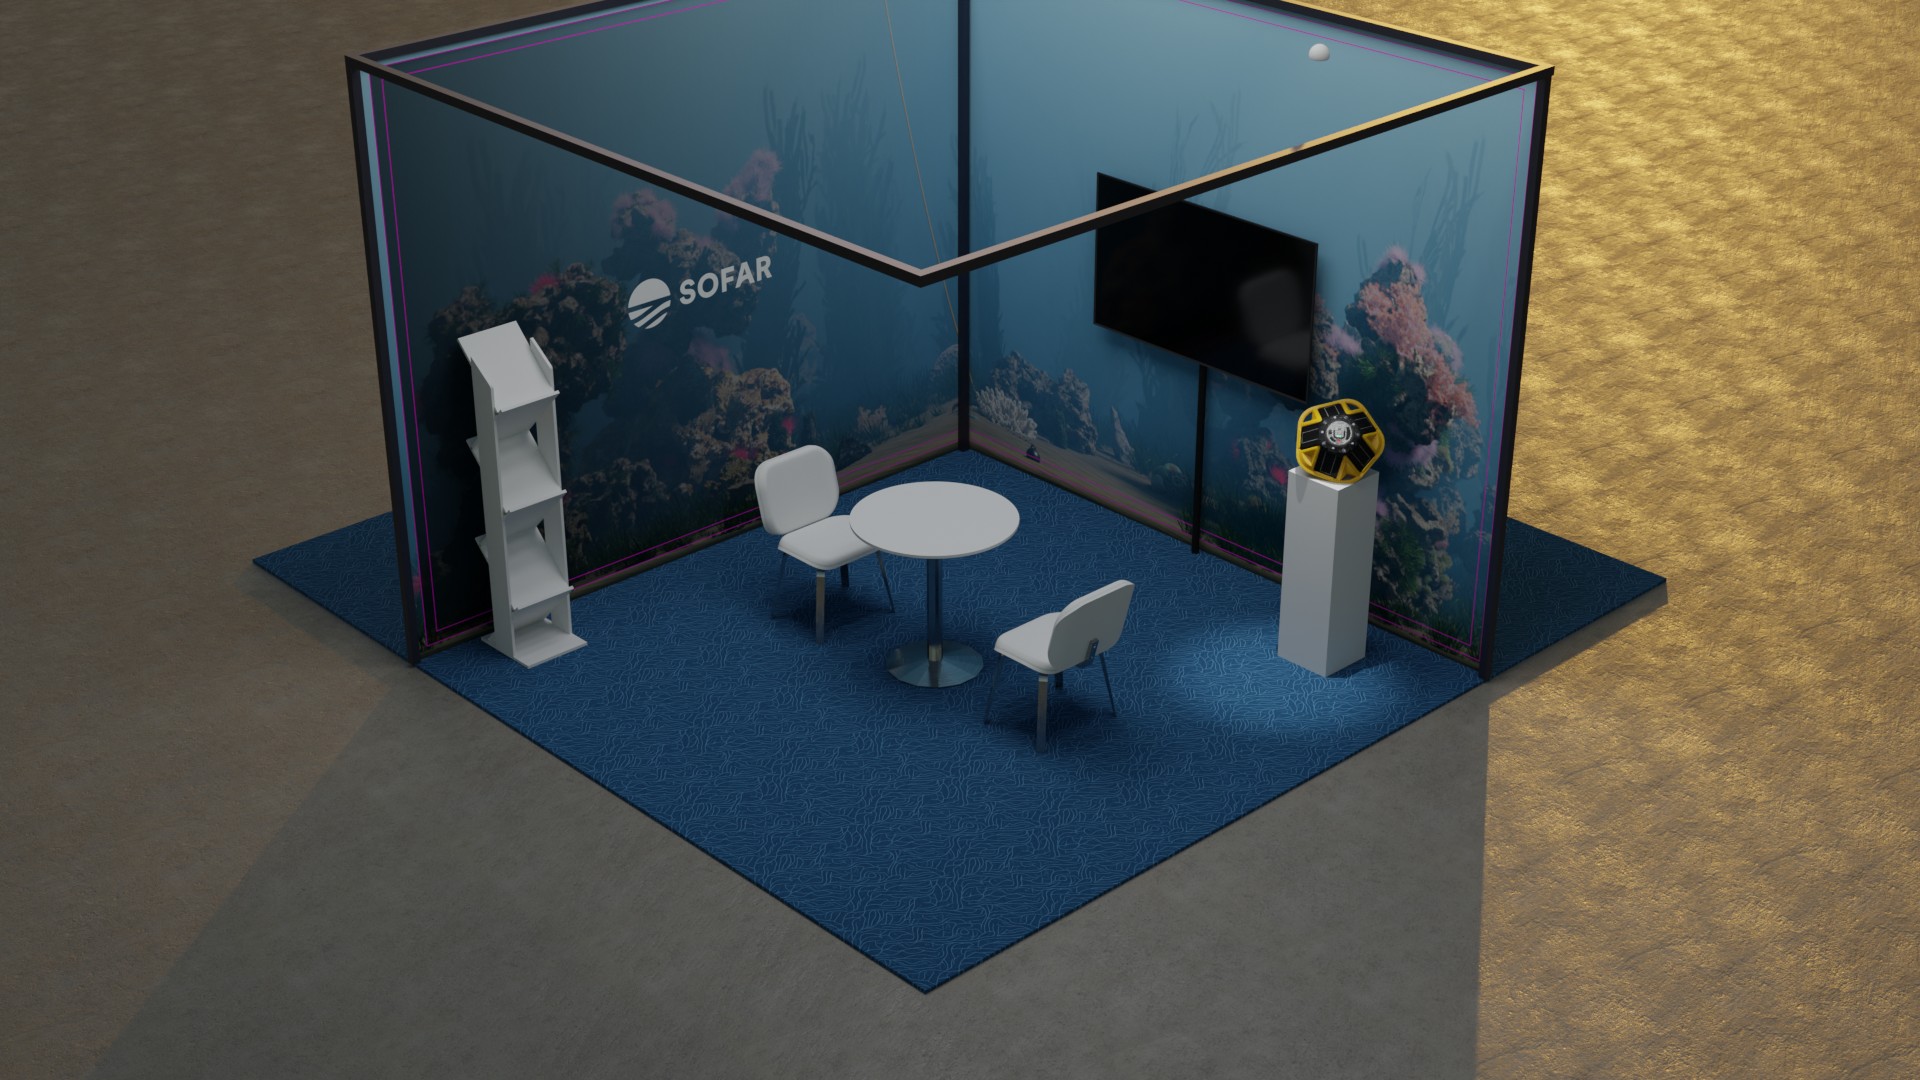
The booth as I mocked it up in Blender before it was built.

Building the Hurricane Ian graphic in After Effects.
The result: a Spotter riding out Ian, September 2022.

Merch: my coral design on a cap.
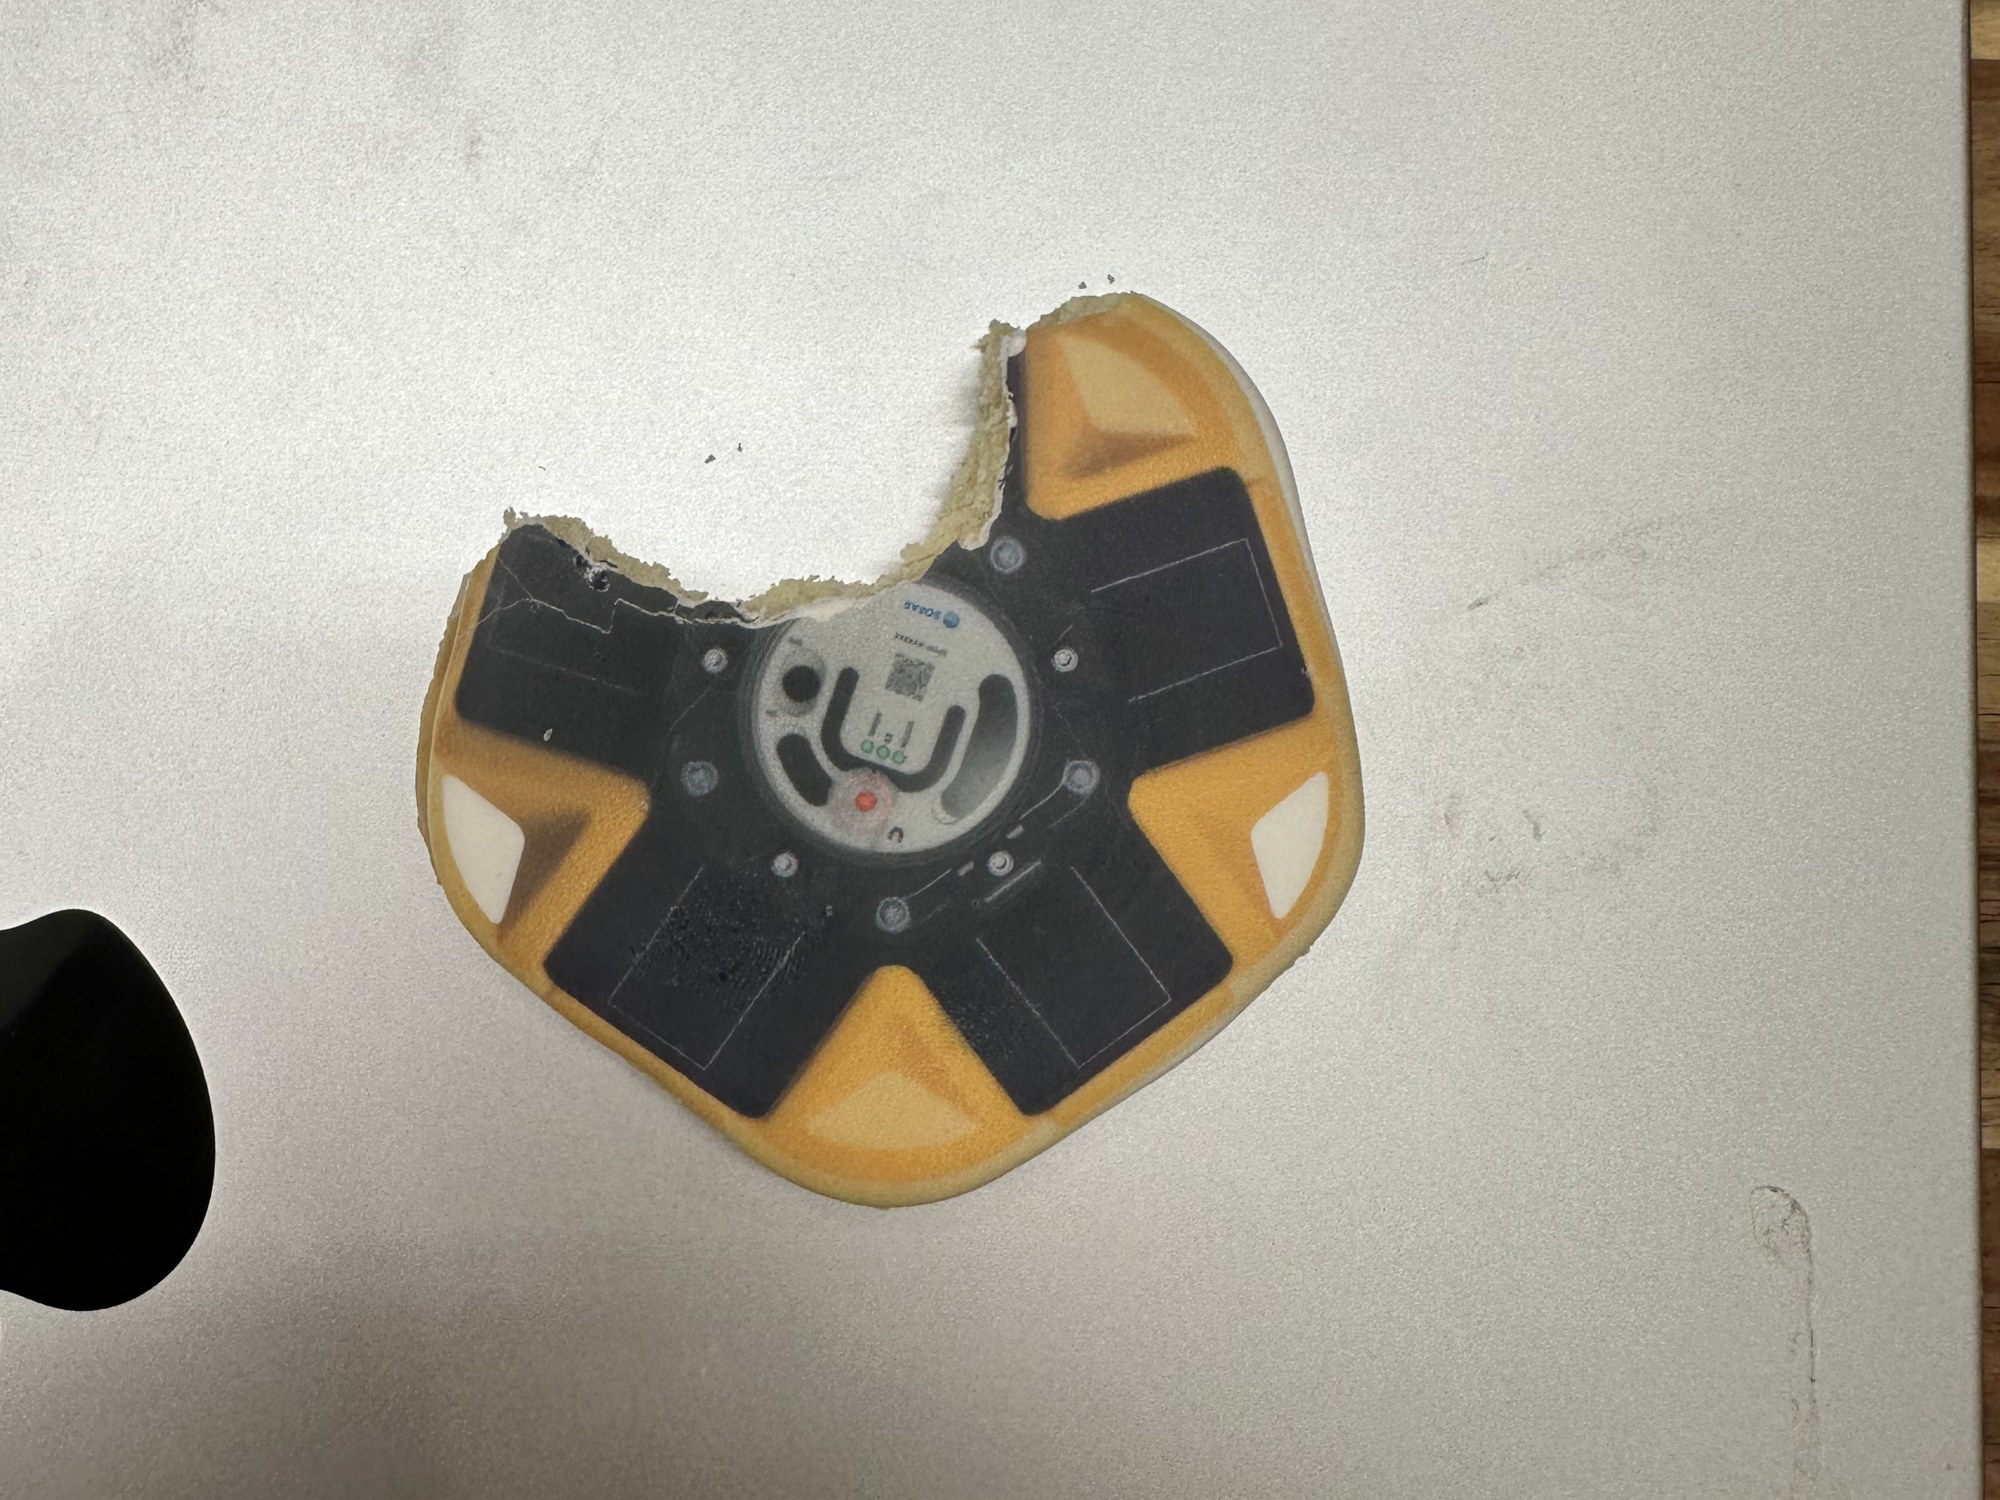
A Spotter cookie I art-directed.

And a Spotter in chocolate.
I didn't track numbers at Sofar for the films, the site or the report. What I can point to is that the work is still running years after I left.